More than halfway through the year, it’s safe to say this is finally the first, full year of travel since the pandemic and its slow, progressive recovery across the globe. How is the industry faring? Are hotels, airlines, cruise companies and tour operators performing at the same level in different areas of the world?
The folks at Skift Research just published a very insightful guide, with 284 pages and over 250 very insightful charts and stats that highlight the good and the (not that) bad about the state of the industry right now. Here are 10 highlights I thought I would share with you.
1. U.S. outbound travel is $2 billion above pre-pandemic level
In case there was any doubt, this firt chart speaks loudly: travel is back! More than ever before, may we add! More than $12 billion spent in outbound travel for Americans in 2023, compared to $10.5 billion in the previous record year, 2019.
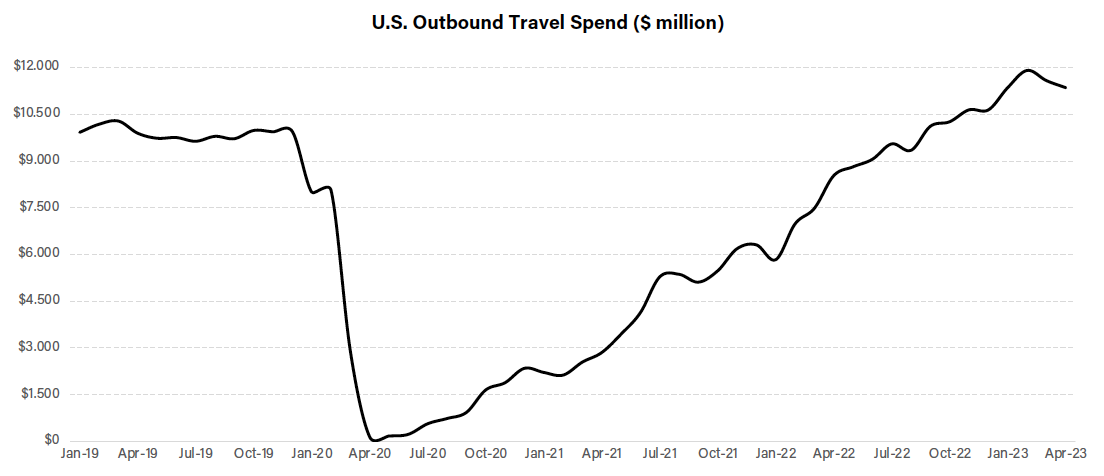
Will inflation and economic uncertainty slow down this curb in coming months? It’s always a possibility, but it seems like the “revenge travel” phenomenon is still there, with people yearning to make up for lost time and travel extensively.
2. Europe travel is back… except for Russia!
What’s true for the United States is also true for Europe, an important source of outbound travelers in Europe but also to North America and Asia. As we can see in the chart below, all European countries have recovered to 2019 levels, after difficult times in 2021 and 2022.
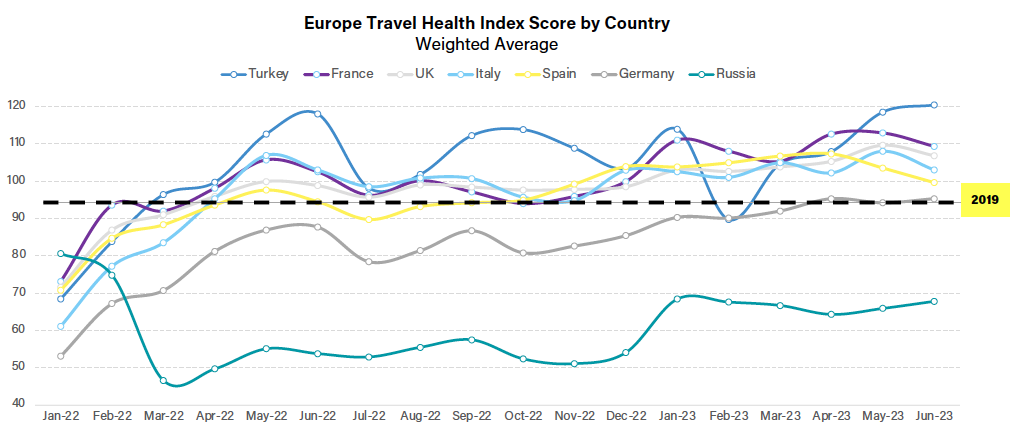
The only notable exception is Russia. But this is because of the war in Ukraine, which began in February 2022 and is still raging, unfortunately. The fact that they are at 70% of 2019 levels is somewhat mind-boggling, demonstrating resilience for outbound travel, if anything.
3. Canada in top 5 destinations sought by Chinese travelers
This Skift report also highlights another exception, which is China. Recovery for travel has been slower there because of the much longer period of confinement and restrictions due to Covid-19. As travel resumes though, in particular on the international front, it’s interesting to see the most sought-after destinations by Chinese travelers.
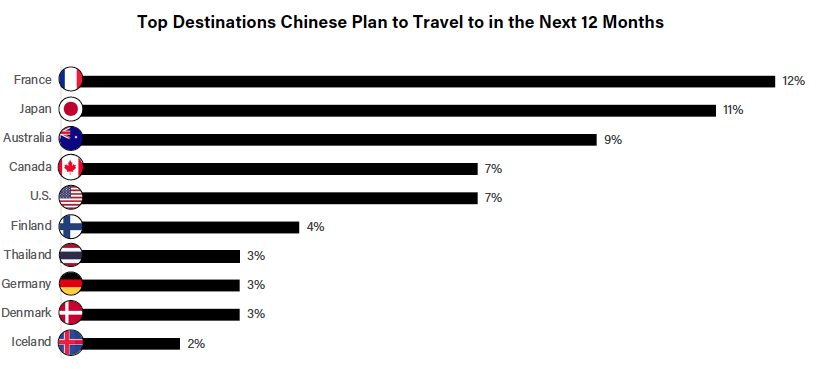
France is #1 in on this chart, perhaps due to the upcoming Summer Olympics coming in 2024. Japan and Australia are logical front runners, due to geographical proximity and long-standing history in terms of tourism background. But I must say I was surprised to see Canada up there, on par with USA, making the top 5 of destinations most desired by Chinese travelers. It will be even more interesting to see if airline capacity resumes to 2019 levels, which really is the key to converting interest or desire into firm bookings…
4. Rising inflation poses threat to travel spending…
The report also takes a look at macro economic and consumer trends. One factor often discussed relates to the looming recession, rise in costs of goods an its overall impact on intentions of travel. As can be seen in this chart, respondents of this survey conducted earlier this year showed clear signs of worrying about high prices.
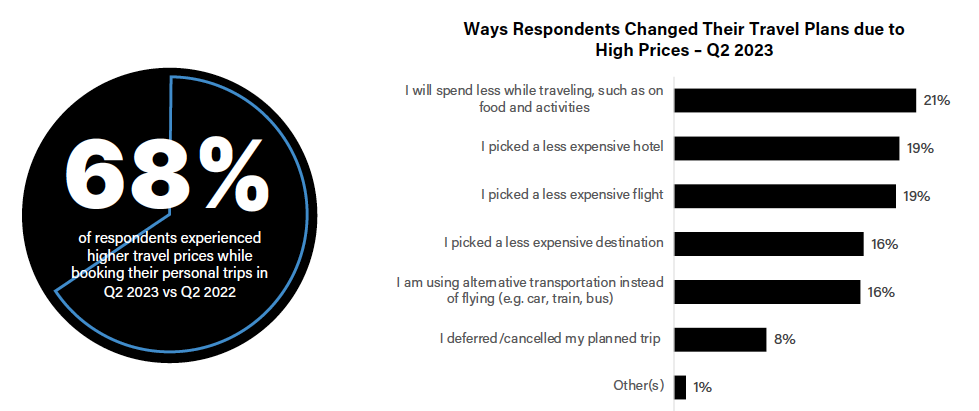
Hotels, airlines or restaurants should take notice of these insights, and ensure proper communications and garantees are made on their website, social media and other key digital outposts.
5. …Yet there are still 240 million trips in pent-up demand
On a more positive note, it’s good to see that even though inflation and rising prices may worry some people, there is still lots of pent-up demand out there when it comes to international travel. As the chart below clearly shows, should international travel follow the trend line it had prior to the pandemic, there would still be over 240 million trips to be made in order just to catch up!
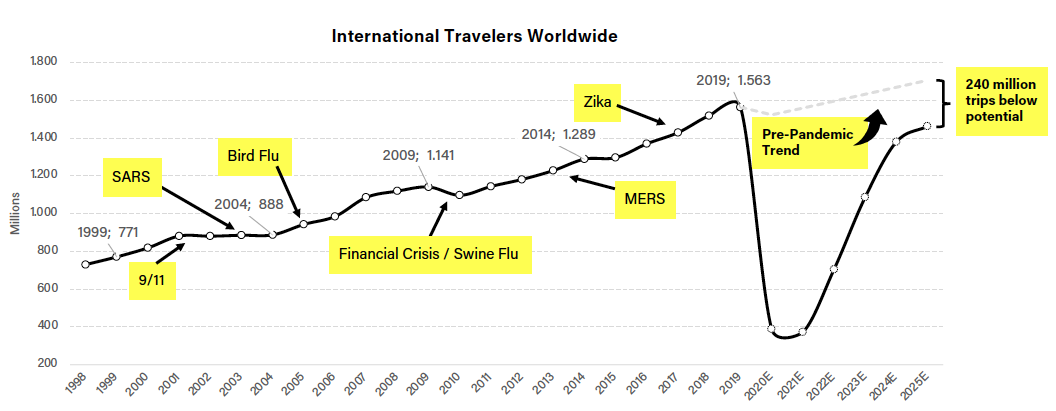
That said, this figure is true on paper but even if only 50% of this potential pans out, this would still represent a fair chunk of pent-up demand that can and will remain for the rest of 2023 and 2024.
6. People now work 2.2 days from home
From a section digging into business trends, I really like this one chart:
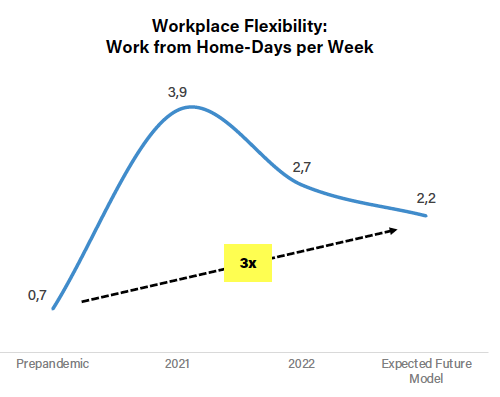
As we can see here, according to Deloitte, people used to take on average 0.7 day per week to work from home prior to pandemic. Out of necessity, this figure rocketed to almost 4 days a week (3.9) in 2021, reducing to a bit under 3 days a week (2.7) by 2022.
This hybrid, or remote working, trend has obvious impacts in the travel industry. Call it bleisure or blended travel, we are seeing this trend enduring, as Deloitte now predicts workers will stay at home 2.2 days per week.
7. 56% of Americans book direct, down from 67% in 2021
Remember how some folks were saying, during the pandemic, that users were moving away from OTAs and finally booking direct? That this would be a long-lasting trend? Not so. It was purely contextual, in the sense that since we could not travel internationally, we would opt for domestic travel. And this, in turn, is much more conducive to direct bookings – be it online, via call centre or just walk-in.

Fast-forward to 2022 and now in 2023, and we are seeing the exact opposite. After reaching a high of 67% of U.S. travelers booking direct in March 2021, this figure has dwindled progressively to hit 56% by end of 2022. With both Expedia and Booking having invested in their loyalty programs, and with continued massive online advertising across the board, third party sites should continue to get more and more traffic (and revenue).
8. Expedia and Booking spent over $7 billion in online advertising in 2022
As a segue from the previous point, this chart is also interesting. It illustrates how much dependence there is on paid traffic (or not) for key online travel agencies and distribution platforms.
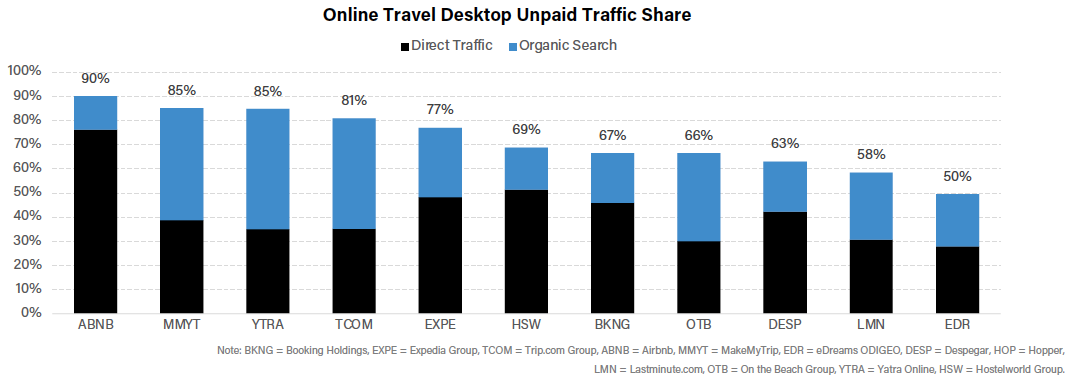
Notice for example that Airbnb generates 90% of its traffic through unpaid sources, with a whopping 75% coming from direct traffic alone. Strong branding, you say?
Expedia (77%) and Booking (67%) also have strong brands, but depend more actively on paid traffic in order to compete in their respective markets. According to latest reports, in 2022 Expedia spent $3.8 billion, while Booking spent $3.2 billion, for their online advertising efforts. It is estimated that 65% of this investment went to Google alone!
9. 69% of GenZ who book a cruise use travel advisors
It’s interesting to see that younger generations, usually more tech-savvy, are those who seek out travel advisors when it comes to booking cruises, rather than doing it themselves online. In fact, more than 2/3 of GenZ, Millenials and GenX users – in other words folks ranging between 20-55 year old – prefer to deal with a travel advisor rather than deal direct with cruise companies!
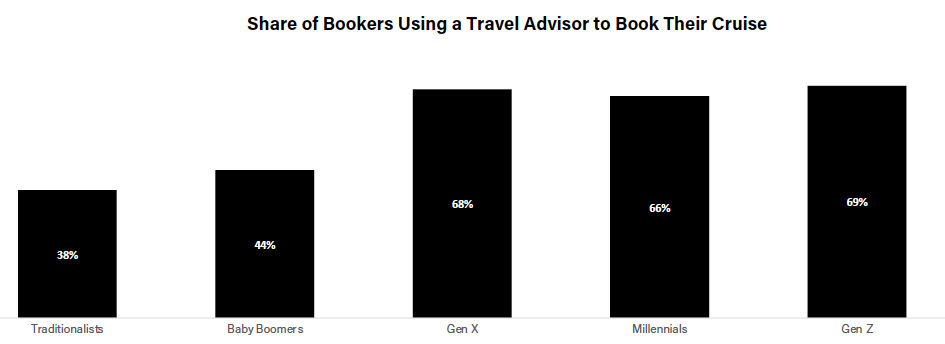
Only 44% of Baby Boomers used a travel advisor to book their cruise? That seems like an unusually low proportion, specially compared to younger generations.
10. Hopper, VRBO and Airbnb vying for top travel app dominance
Finally, did you know Hopper was the most downloaded travel mobile app in the U.S. in 2021? It’s interesting to see the fluctuations when it comes to app downloads, with Airbnb and Vrbo’s popularity clearly showing that users are embracing vacation rentals more than ever.
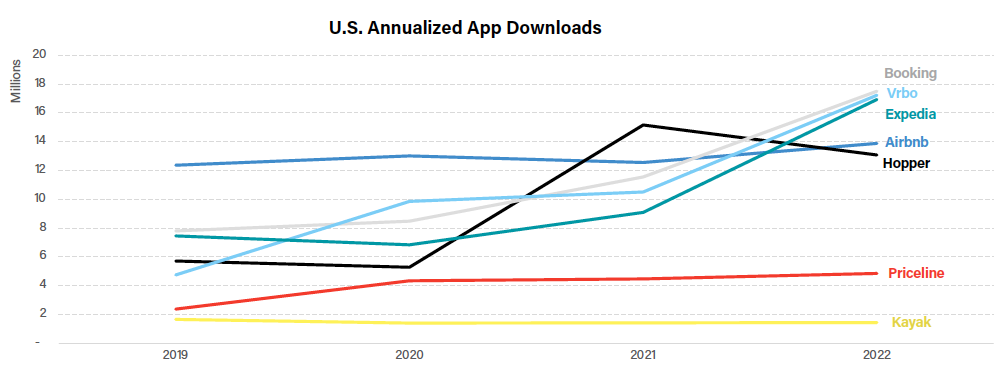
The story is somewhat bleaker for Priceline and Kayak, with a flatline throughout the past four years, while competitors are evidently moving upwards.
To download this complete guide from Skift, click here.





Leave a Reply