A January 2013 study by Adobe looked at how various industries performed across various devices and how these industries’ websites performed in certain specific categories, including site stickiness, smartphone and tablet traffic, among others.
In the travel and hospitality industry, we tend to focus and compare ourselves between transportation companies, i.e. airlines, car rentals, trains, etc. hotel chains and perhaps destinations (DMOs). But how do we compare with financial services, retail, high tech or perhaps even media & entertainment? That’s where this study becomes enlightening.
TIME-CONSUMING AND STICKY
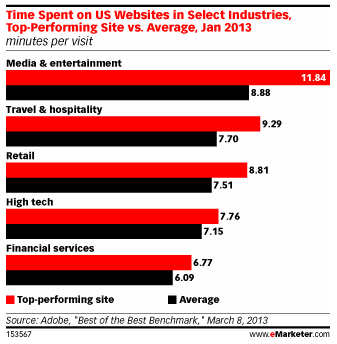
A first finding from this report is that consumers spend more than 9 minutes on top-performing travel & hospitality sites, while the industry average sits at 7.7 minutes, making it the second most performing among industry analyzed.
Takeaway: Websites that performed best, most notably media and entertainment sites, tend to offer videos or rich media to boost time spent online. Thus, including presentations or visual displays via slideshare, podcasts or photo galleries are great ways to keep customers on your site longer.
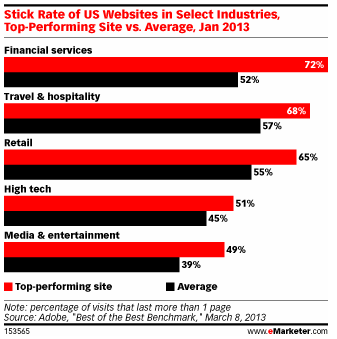
A similar conclusion can be drawn when looking at the “stickiness” factor from various industry websites, where stickiness was calculated as the percentage of visits that result in more than one web page view. In this category, travel & hospitality actually scored highest of all, with a 57% stick rate. This is great news for top-performing sites, as Adobe suggests stick rate is perhaps the most important measure for acquisition and engagement which, if a site is well designed, can lead to increased conversion down the decision-making funnel.
Takeaway: Check-out this measure in your analytic dashboard and see how you compare with top-performing sites in the travel & hospitality industry. How can you ensure consumers visit more than one page on their next visit to your site?
PERFORMING WELL ON MOBILE & TABLETS, TOO
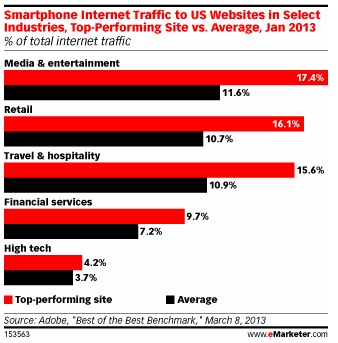
Looking at mobile usage also shone well on the travel & hospitality industry, which ranked second with an average of 10.9% of its total internet traffic coming from smartphones in the US during the month of January 2013.
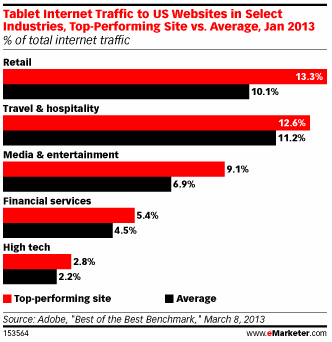
These results are somewhat different than those found earlier in 2012, where it was estimated that 21% of all internet traffic to travel and hospitality websites was coming from mobile devices, with roughly 14% coming from smartphones and 7% from tablets. When looking at the chart below, focusing on tablet traffic, we see the growing importance of these devices in the travel decision-making ecosystem.
In terms of traffic from tablet devices, travel & hospitality leads all other industry with an average of 11.2% of all its internet traffic! Which means that, when combining with smartphone traffic, the industry average is now at 22.1% with top-performing sites seeing as much as 28.2% of their internet traffic coming from mobile devices!
Takeaway: Google Travel estimated that almost 25% of all travel-related searches online were coming from mobile devices by end of 2012 and this figure is expected to rise to 40% by end of 2013. This study by Adobe tends to confirm this trend, with a particular emphasis on the importance to have a strong tablet focus, specially knowing that conversions rates from these devices tend to surpass those from smartphones by a ratio of 3:1.
So it’s no longer enough to simply have a mobile application or an optimized version of your website for mobile: in travel marketing, a mobile-first or responsive web design approach is becoming a must!


Leave a Reply