Ever wondered what you really need to measure in order to gauge your success on social networks? The social conundrum is that we often find it hard to report on the success of given initiatives, while at moments we get overwhelmed with a stream of stats and indicators, struggling to make sense of it all. Too much data, or not enough?
Here are the key performance indicators (KPI) I typically focus on with my clients, so I hope you find this useful!
NOTE: These are metrics that ought to be followed by social media managers, in order to report progress and performance of given accounts on these social networks. It’s assumed these metrics must be aligned with business metrics, i.e. sales growth, increase awareness, generating leads, etc. but it isn’t the focus of this post.
Facebook Metrics
There are a variety of metrics that can be measured through Facebook’s native analytics module, so it is up to you to determine which ones help your case and align with business objectives.
While the data can be sliced and diced per day, per week or as per the past 28 days, I tend to prefer the more aggregated view (28 days) in order to compare on a month per month basis. Here are some key metrics to consider:
- Page Likes (new likes, unlikes, growth vs previous month and YoY)
- Total Reach (organic, paid)
- Total Impressions (organic, paid)
- Engaged Users (page level)
- Engaged Users (post level)
- PTAT – people talking about this (folks who engaged with your content, basically)
- EdgeRank
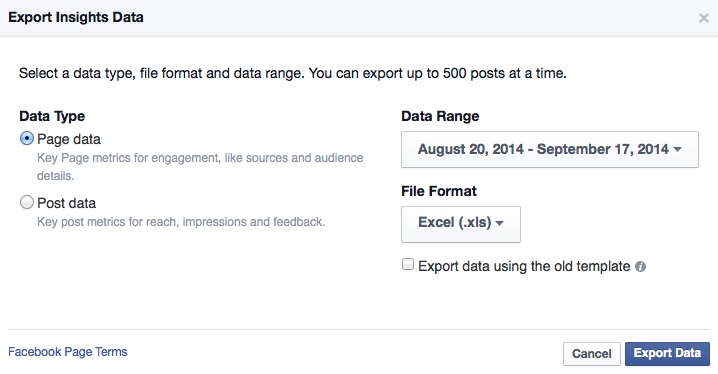
Most of these metrics are provided when you extract a report, either at page level or post level, for a Facebook Page. But in order to get your EdgeRank, or how your Page scores as per Facebook’ complex newsfeed algorithm, I recommend using a third party application such as EdgeRankChecker.
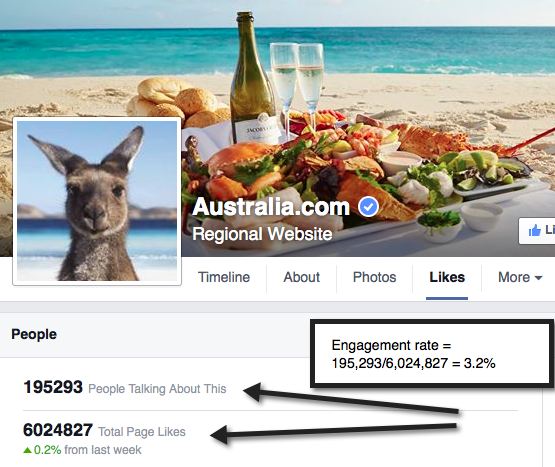 One of my favorite metrics, not provided by Facebook reports per se, is the engagement rate of a page. You can find this number by dividing a page’s PTAT by its number of followers.
For example, Tourism Australia had an engagement rate of 3.2% when I checked it last. NOTE: This rate evolves daily, along with your PTAT and number of followers.
Looking away from Facebook analytics module, you will also want to monitor KPIs that address other key marketing goals and business objectives, such as:
- Customer service related issued (quantity, resolved)
- Traffic generated to your website
- Sales and/or Offers redeemed
- Questions answered or comments passed on (product improvement)
- Human Resources (potential candidates, and other queries)
Useful read: Download this free guide by Simply Measured: Beyond Reach: The Critical Facebook Metrics You Should Measure
Twitter Metrics
Twitter recently made its own analytics module available to all, but there have always been numerous ways to gather knowledge about an account and tweets performance, i.e. Hootsuite reports.
Brands should thus focus on understanding and monitoring at least the following indicators:
- Followers (growth)
- Follower segmentation: interests, location, gender, etc.
- Total Impressions (organic, paid)
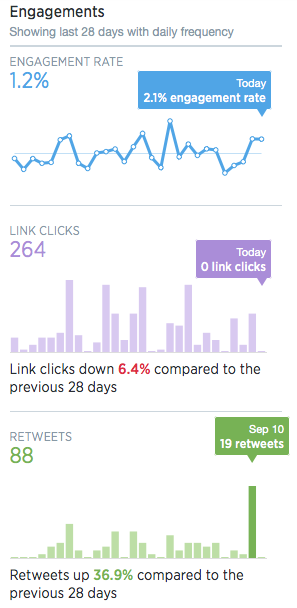
- Engagement rate
- Tweet activity: retweet, favorites
In a very similar fashion to Facebook, we ought to monitor KPIs that are perhaps not captured within the Twitter analytics module but that remain nevertheless very important. For example:
- Customer service related issued (quantity, resolved)
- Traffic generated to your website
- Competitive analysis (hashtags, lists)
- Questions answered or comments passed on (product improvement)
- Queries dealt through direct messages
In my experience, these have been metrics useful to monitor within a weekly or monthly dashboard, depending on your business. In the travel industry, we follow these indicators typically on a monthly basis.
YouTube Metrics
When producing a video then sharing it over the web, we typically focus on one number: views! While views are important, it’s also easy to buy “views” from link farms and other scam sites.
Thus, it’s important to have a few more indicators to monitor in order to see how successful we are on YouTube.
- Subscribers
- Views (organic, paid)
- Likes & Dislikes
- Comments
- Sharing
- Source of playback (mobile, embedded, etc.)
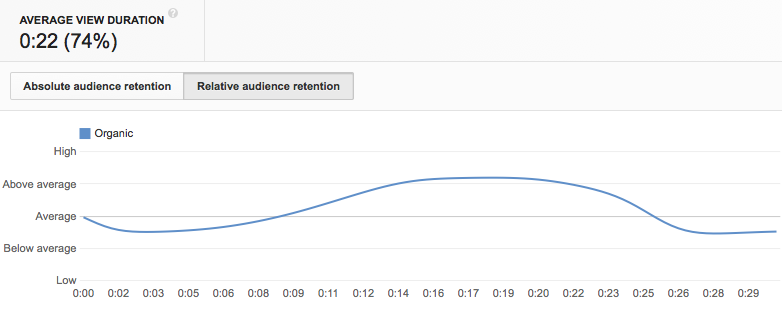
- EMW: Estimated Minutes Watched
From a relationship marketing perspective, I tend to emphasize getting more subscribers, since this is the equivalent of gathering emails and building a database of people with whom we can communicate regularly, for example when a new video comes out.
And while views give us an indication of success, I tend to take a closer look at the EMW stat: did people watch 5% of our video? 50%? 95%? It’s up to you to define what is considered “successful”, depending on length of videos, when the call-to-action shows up, etc.
While referral traffic to your website is usually an important metric to consider, it may less be the case with videos, as calls-to-action may lead to different channels, i.e. subscribe to channel or newsletter, call for more details, download whitepaper, etc.
Recommended reading: YouTube Analytics: 10 Ways To Track Video Performance
Instagram Metrics
Instagram may not (yet) have its own analytics module, but it did recently announce this was going to change shortly, in particular for business accounts interested in spending on advertising on the popular mobile application.
In the meantime, you can access interesting insights through Iconosquare (formerly known as Statigr.am). KPIs to measure on Instagram:
- Followers (new, lost, growth)
- Total Media (new media over the past month, photo vs. video)
- Likes (new, total)
- Total Reach (organic, paid)
- Impressions (organic, paid)
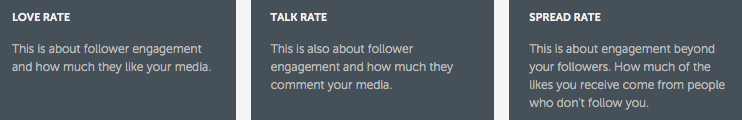
- Engagement rate (love, talk, spread)
Because of its visual, mobile-native nature, Instagram won’t necessarily generate traffic to your website. It will however generate content that you can repost, feature on your website, newsletter, Facebook page and various other networks.
Brands who build contest and monitor closely a given hashtag, or numerous ones, can therefore track the reach and engagement levels created by these media, whether photo or video.
Google+ Metrics
One of the best free tools around to get a better understanding of your personal or brand performance on Google+ is without a doubt Circle Count.
Ranking both individual and brand (or celebrities) profiles per country and globally, it’s a neat tool to discover influential people on Google+, and see how these folks perform, what they share, and so on.
For Google+, here are the basic indicators to keep track of:
- Followers
- Views
- Posts
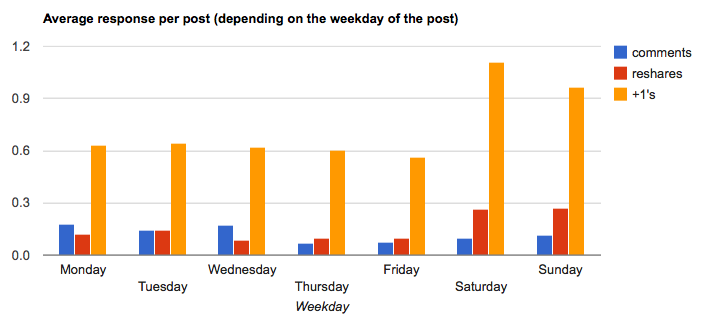
- “+1”
- Comments
- Mentions
- Re-shares
- Reach
- Impression
- ProfilesRank
- Referral Traffic
The ProfilesRank is simply how you or your organization ranks against other G+ users, so the lower the number, the better it is. In fact, we all strive to be number one, right?
As for referral traffic, even though Google has recently axed its authorship program, Google+ remains a potential traffic referrer to your website, in particular if you host a dynamic blog, or if you guest blog on recognized platforms.
Pinterest Metrics
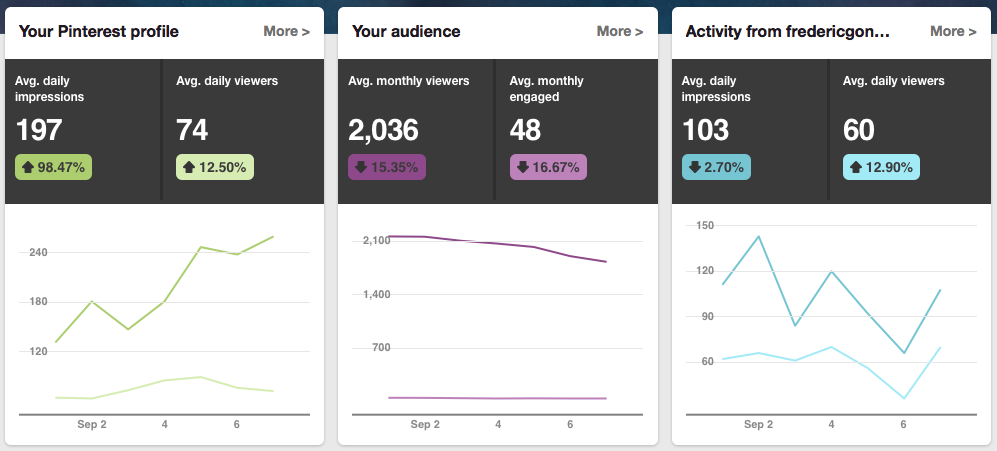
Last but not least, Pinterest has come up with its own modified and enhanced analytics module in recent weeks, beefing it up so that potential advertisers will be interested in spending dollars on the platform, among other things.
NOTE: In order to access analytics on Pinterest, you must have a business account, a website linked to your account, and it must be verified. Click here to learn more on this
Above and beyond traffic sent to your site from Pinterest, here are other important metrics to monitor:
- Pins
- Pinners
- Repins
- Impressions
- Clicks
- Engagement rate
If you can at least monitor the above indicators on each platform during a period of 6-12 months, it will allow you to get a better view of how engagement is evolving, if it’s generating leads, sales or traffic to your site, making it more tangible to report and to justify resources, financial or human, to maintain your efforts.
Read also: The New Pinterest Analytics Tool: How To Use it for Business
Of course, these are but a sample of the possibilities and the above KPIs may or may not fit your reality. The most important thing is to align key indicators with business objectives, not just marketing goals, as social media plays a much broader role within organizations than simply drive sales!


Leave a Reply