Have you ever heard of a ship’s captain sailing the high seas without a map or high-tech instruments to navigate? Does a pilot fly an aircraft without analyzing vital statistics, such as flight speed, altitude, longitude and latitude?
This analogy also applies to businesses that invest in their online presence—but don’t measure their website’s results. And yet there is a free tool that can help them better understand their website performance: Google Analytics.
Once you have integrated Google Analytics within your website, here are six key performance indicators (KPIs) that can help you analyze and monitor its performance over time:
-
Traffic
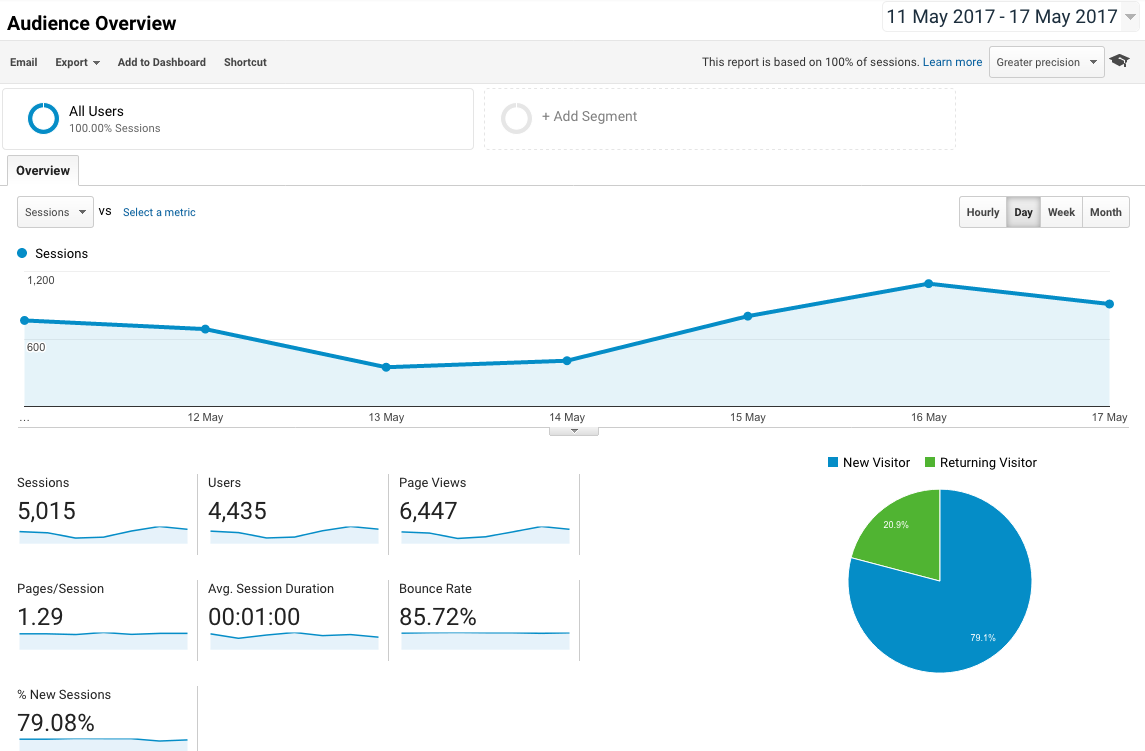
Every company that owns a website—whether or not it has ecommerce components —wants to know how much traffic it generates. In theory, the higher the traffic, the better your chances of generating sales online or through your other distribution channels.
Google Analytics gives you overall statistics regarding your website’s traffic for a set period of time (in hours, days, weeks or months):
- Number of sessions
- Number of unique visitors
- The average number of pages viewed per visitor
- The average session duration
- The percentage of new sessions vs returning visitors
- Bounce rates
Google Analytics is easy to use: you can change the periods you want to analyze, compare your current results with last month’s or last year’s performance, etc. You can even combine variables to deepen the insight into your website’s traffic.
-
Traffic composition
Knowing how much traffic your website generates is great, but it’s even better to know WHO visits your site, and perhaps where they are visiting from.
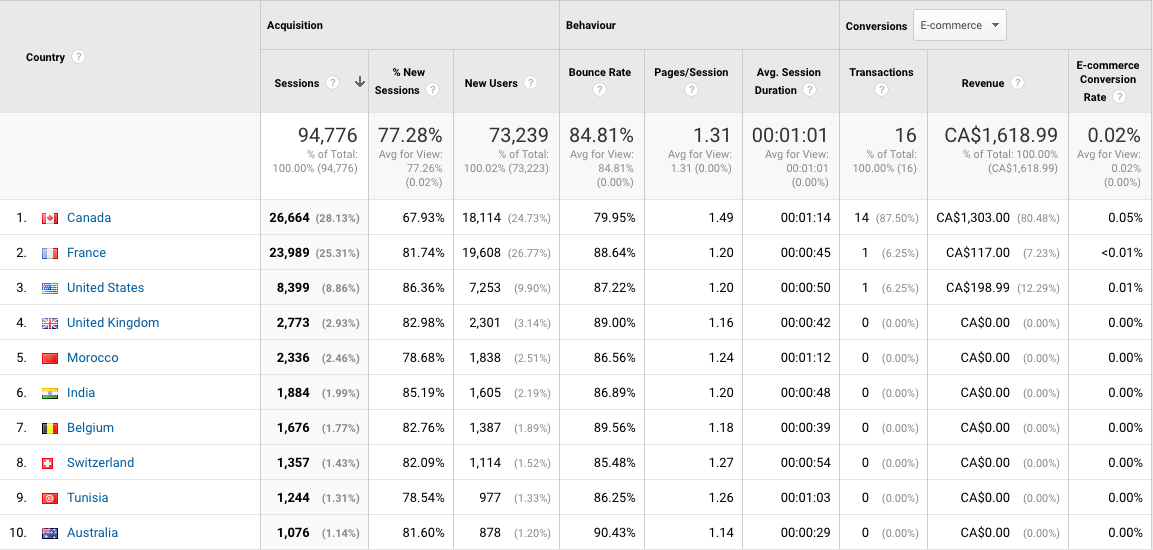
If you want to invest in AdWords campaigns, remarketing banners or even traditional marketing (radio, TV, print), it’s important to know where your potential or existing customers come from.
Google Analytics is a true goldmine of data to learn more about your website visitors:
- Geographic location (country, city, continent, sub-continent)
- Language
- Gender
- Age
- Interests
- Visit recency and frequency
You can also discover what devices and browsers visitors use to view your website. This information can be invaluable should you ever decide to deploy ad campaigns on social media or mobile devices.
-
Which channel do visitors come from?
While it’s important to know WHO visited your website, it’s even more important to find out HOW they found it. Google Analytics is a treasure trove of relevant data to learn more about the most popular ways people end up on your website, such as:
- Natural or organic search
- Direct traffic
- Social media
- Referrals from third-party sites
- Email and newsletters
- PPC campaigns (AdWords)
- Other
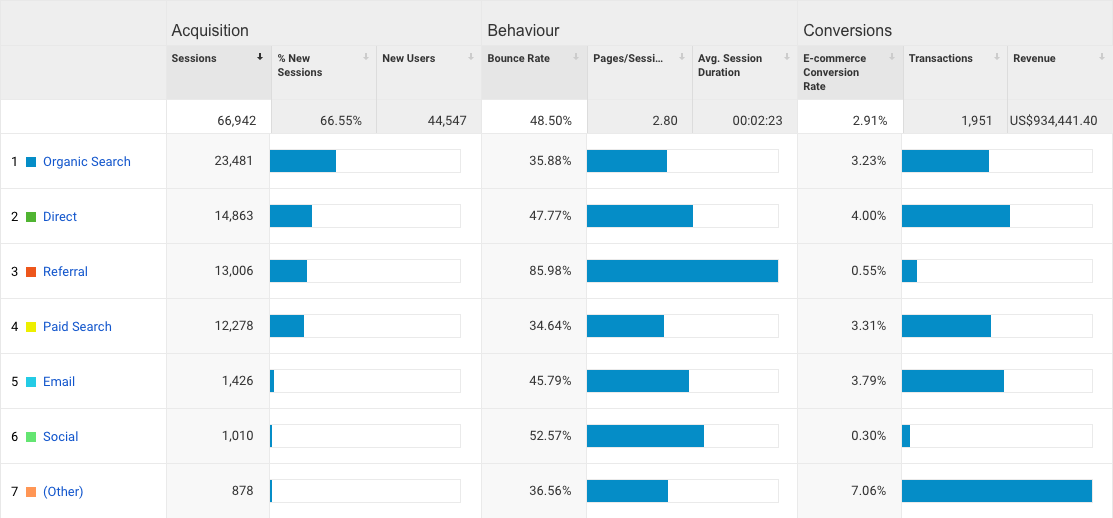
You can even dig further to find out what keywords people use to find your website, even though Google is not as transparent as it used to be with its “Not provided” tag that can skew your website results.
However, you can bypass this issue by using Google Search Console linked with your Google Analytics account.
-
Traffic behaviour
Now that you know who visits your website, how long they stay, the devices they use, how they originally found your business and the keywords they select, you can take your analysis up a notch to find out WHAT they do on your website.
With Google Analytics, you can learn more about the specific pages people visit and which ones incite the most interest (time spent on a page, conversions). You can also pinpoint the least popular pages (high bounce rates, little time spent on the page, few conversions, etc.).
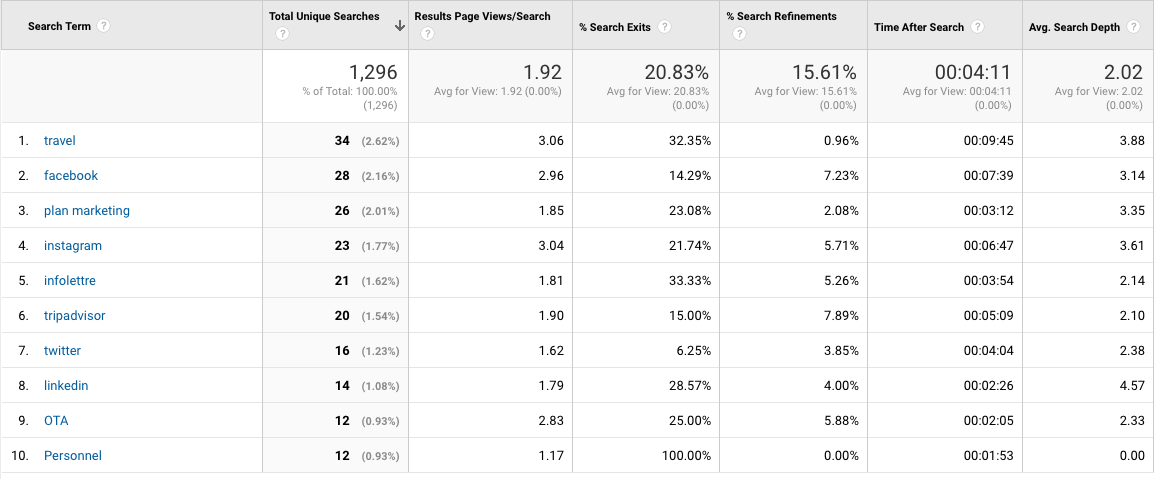
If your website features a search bar, which is strongly recommended, you can also determine what users are looking for on your website. For example, here I see that the term “Facebook” was used 28 times in my website’s search engine tool.
If you notice an upswing in the number of specific terms your visitors use, you know that these terms either interest people or cannot be easily found on your website—hence the reason why the search bar is used.
Google Analytics is very handy to help you understand which pages are the most viewed on your website; this information, which highlights your assets and strengths, will guide you when you want to revamp your website, invest in ads and content marketing.
-
Conversions
Finally, while it’s important to measure the effectiveness of our online marketing initiatives, this doesn’t automatically mean you know how much sales volume you generated.
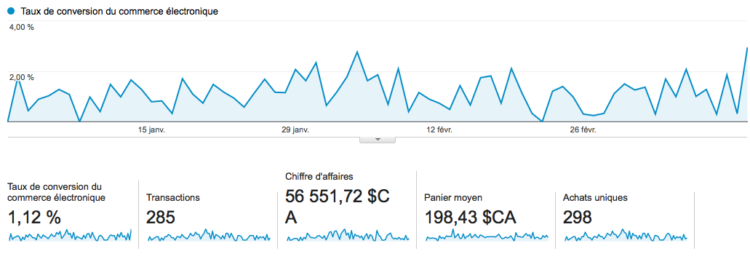
If you have an ecommerce website, you’ll want to measure the conversions from your website’s reservation capabilities. You can measure conversions in a variety of different ways, depending on what actions you want your website users to do:
- Download a map of your destination
- Sign up for a newsletter
- Fill out an order or request a quote form
- Click on a button that leads to a promotion or last-minute deal
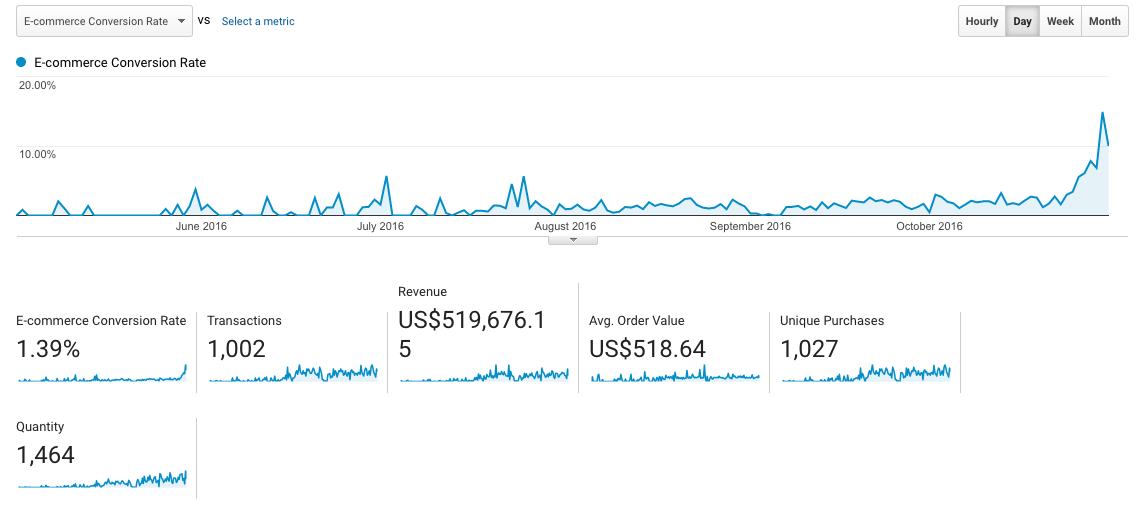
The business intelligence you can glean from this tool can be correlated with your overall business goals and used to monitor, over time, the performance levels of your organic and paid online marketing initiatives.
-
Real-time data
One final aspect that needs to be underscored is the ability to access real-time statistics of your website. This can be really useful when you launch a new product or make changes to your site, including a new promotion, a new campaign that links to a landing page, new press release or a social media campaign.
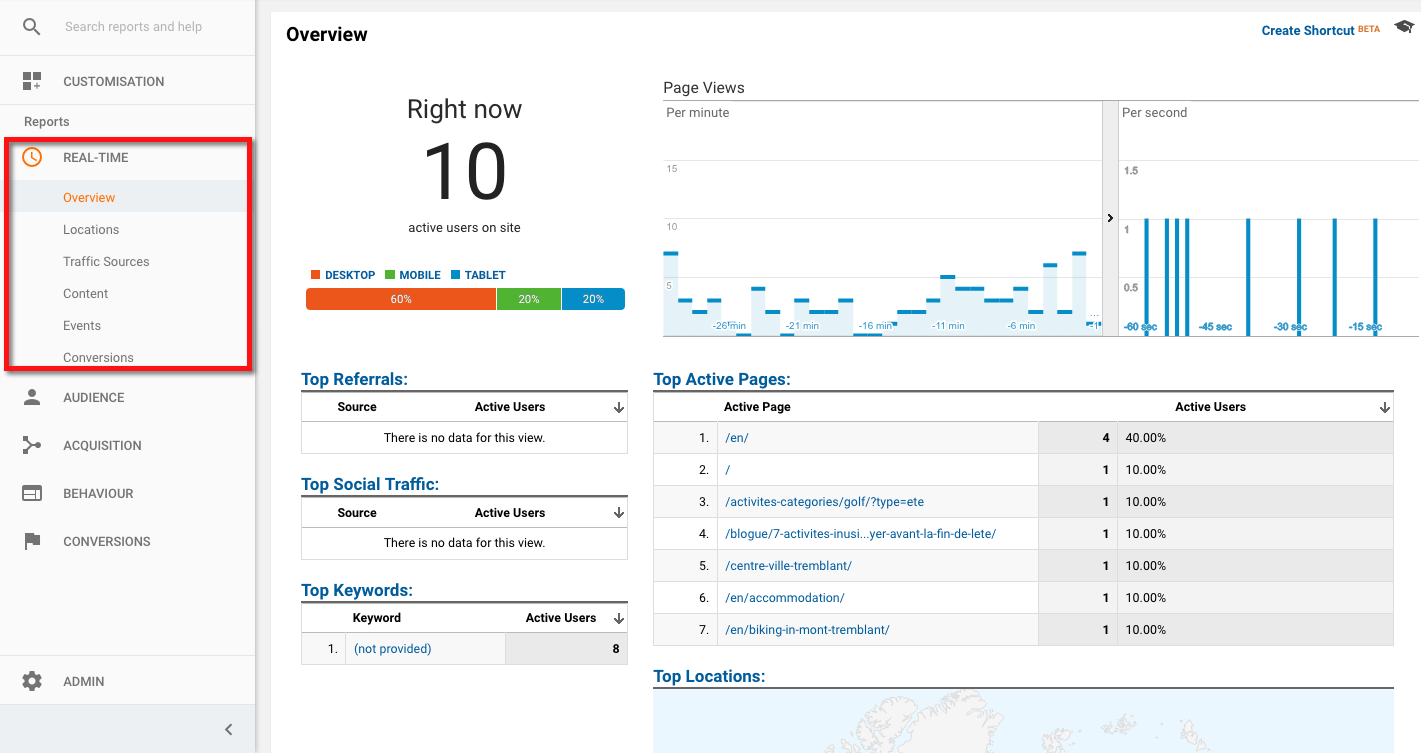
Google Analytics offers an accurate picture of your website traffic, the keywords used and the content most viewed at any given moment. You can create automated reports, shortcuts to your favorite KPIs, alerts and various conversion goals.
The possibilities are nearly endless! However, make sure that you target only the KPIs that will bring true value to your business.




Leave a Reply