Did you know American consumers average 38 visits to travel sites before booking a package? This was one of the key findings from a seminal study by Expedia Media Solutions, the advertising sales division of global online travel leader Expedia, back in October 2013.
Since we all know UK consumers don’t have the exact same online behaviors as their US counterparts, Expedia Media Solutions released today a study taking a look at content consumption in the UK, comparing the vacation package planning and booking phases across both UK and US consumers. The findings are quite telling!
PLANNING STARTS EARLIER (SLIGHTLY)
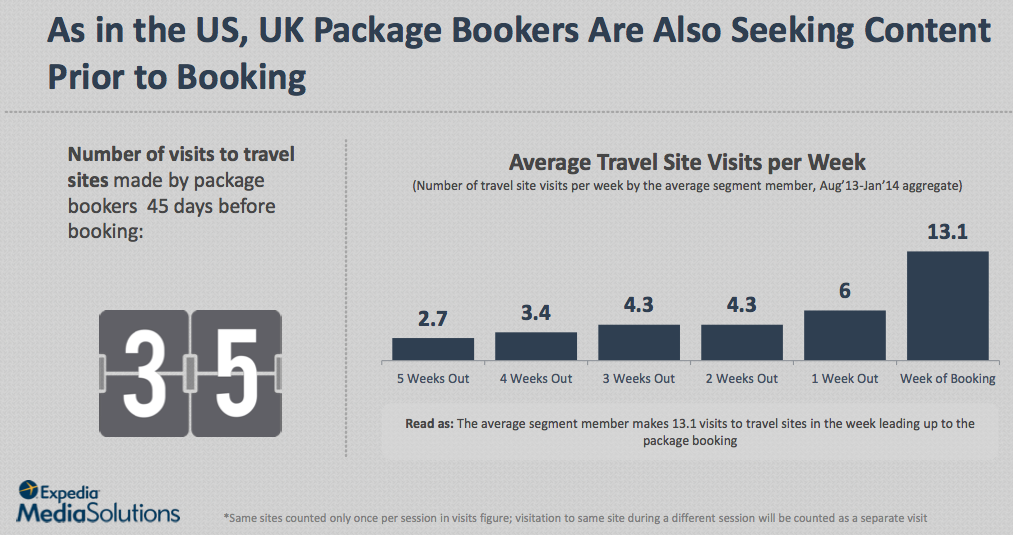
The distribution of average travel site visits per week, in the 45 days leading to booking a package, is not a big differentiator between US and UK consumers.
As we can see above, in the UK consumers will make 35 visits, of which 54.5% take place a week out or within days of booking. In the US, consumers make 38 visits, of which 59% take place a week out or within days of booking. On this aspect alone, things seem pretty similar.
WE DON’T VISIT SAME SITES
Yet while we visit just about as many sites during the booking planning process, there is a stark difference in what types of sites we visit, depending of if you are American or from the United Kingdom.
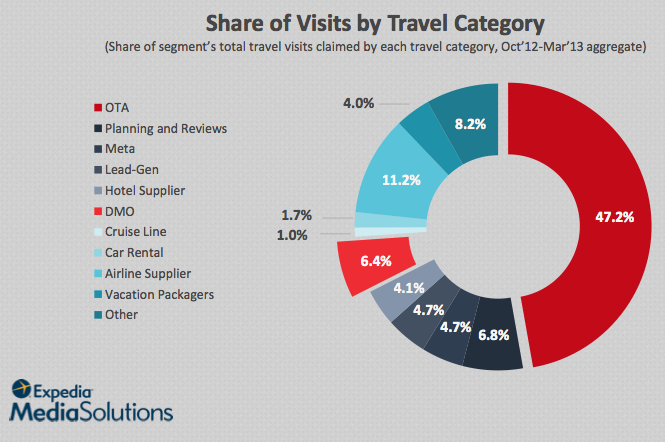
From a travel marketing perspective, the very first striking element is the overwhelming domination of online travel agencies (OTA) such as Expedia, Booking, Orbitz and such. Almost half (47.2%) of total travel visits by US consumers go to these sites!
Coming in at a very distant second position, with 6.8% of total travel visits, are Planning and Review sites, i.e. TripAdvisor. A surprisingly low figure, considering the alleged influence of such sites in the travel decision-making process according to various studies. In third place come Destination Marketing Organization (DMO) sites, representing 6.4% of all travel visits by US consumers. So how do these figures compare with UK consumer behavior?
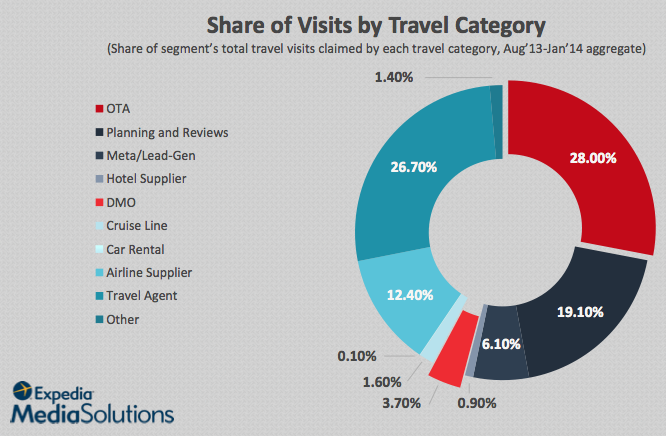
Looking at this chart tells a whole different story, doesn’t it? Here are some of the key highlights:
- OTAs have a lot less influence in the UK: visits to OTA sites represent 28% of total travel visits, which is a lot less than in the US (47%);
- On the other hand, TripAdvisor and other planning & review sites play a bigger role, with 19.1% of total travel visits, which is almost three times more the proportion than in the US (6.8%);
- Destination sites play an even smaller role in the UK consumer mindset, representing only 3.7% of total travel visits, versus 6.4% in the US.
Yet the biggest gap in this picture, without a doubt, comes from the role of traditional travel agents, who obviously play a bigger role in the UK, with more than a quarter (26.7%) of total travel visits. Compare this with the dismal 8.2% share travel agents get in the US!
EXPEDIA VS BOOKING
Not only do US and UK consumers differ in how much they visit OTA sites, they simply don’t visit the sames ones altogether. There are historical reasons to this, of course.
The most obvious one being that Expedia is an American company, while Priceline (and its subsidiary Booking) is European, which explains why they have always dominated and grown in their respective geographic areas in time.
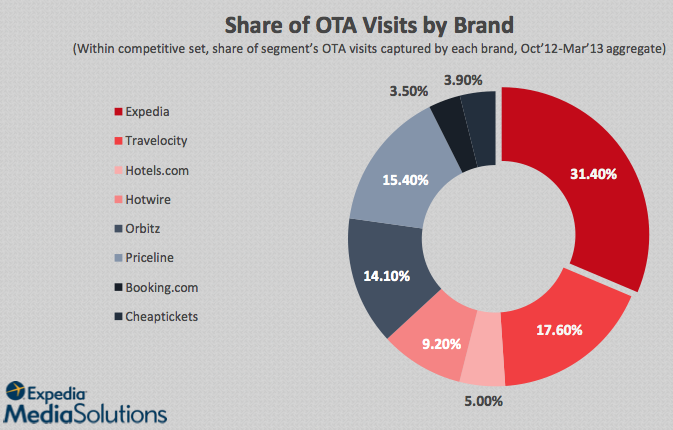
If you take into account the fact that Hotels.com and Hotwire are part of the Expedia family (not to mention Travelocity, whose inventory is now distributed through Expedia as well), Expedia basically owns almost 60% of the share of visits in the US. Compare this to the following chart, for UK consumers:
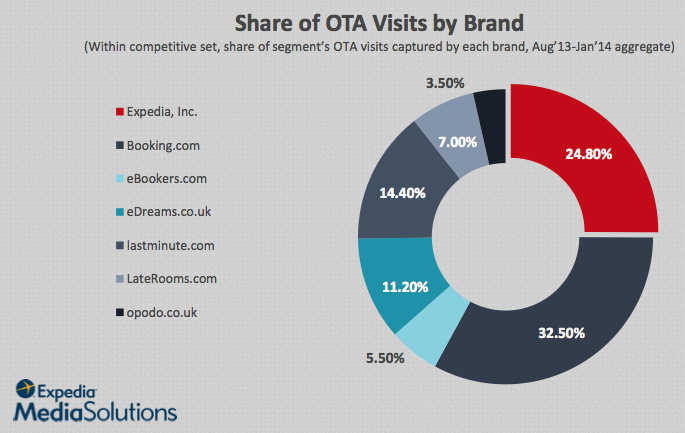
Clearly, it’s a much more diverse environment, still dominated by Booking, which owns a third of total travel visits to OTA sites.
OTHER VARIATIONS
There are of course many other interesting findings in this new research, but here are some I found particularly worthy of mention:
Retail Sites in High Demand During the Vacation Booking Process
In the 45 days leading up to a package booking, UK consumers visited non-travel sites more frequently than their US counterparts, with non-travel sites generating 57% more demand than travel sites. On average, UK consumers visited retail sites 56 times during the booking period, dwarfing the 37 retail site visits in the US.

Planning and Review Sites as Popular as Travel Agents
In the UK, consumers visited TripAdvisor just about as many times as OTA sites and Travel Agent sites the week prior to booking, and slightly less within the week of booking. In the US, the domination of OTA sites is clear throughout the whole 45 days leading to a package booking.
Billboard Effect of DMO Visitation
In the US, there are periods within the 45 day path to purchase where DMO visitation seems to positively impact conversion, in particular within the 9-24 days time frame prior to booking. Unfortunately, this recent report does not tell us if there is a similar effect or potential for UK consumers.
You can view and download the entire Traveler’s Path to Purchase study by clicking here http://bit.ly/1vriQkN.


Leave a Reply