A recent report published by Rival IQ sheds some interesting light on social platforms performance benchmarks across various industries. In its 2023 Social Media Industry Benchmark report, they look at the most important metrics across 14 industries, including travel and hospitality, comparing 2022 with previous years on key platforms including Facebook, Instagram, Twitter and TikTok.
Here are four interesting takeaways for travel brands.
1. Brands (including travel) seeing less organic engagement
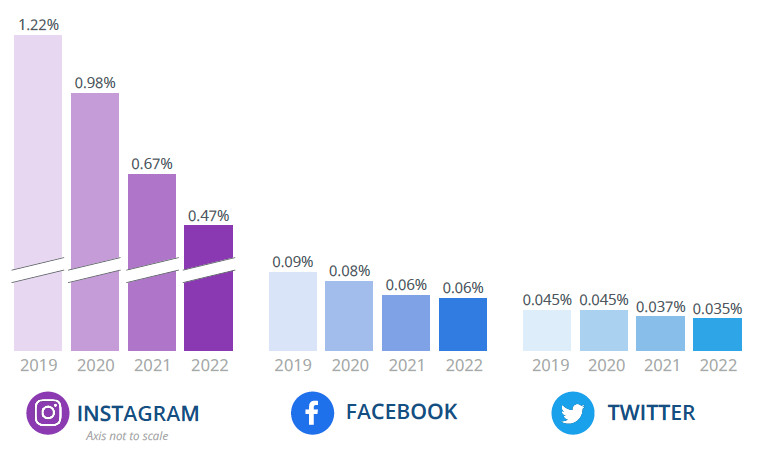
If one chart says it all, this is a pretty telling one:
Source: Rival IQ, 2023 Social Media Industry Benchmark report
Pretty daunting to see how Instagram has been losing steam in the past couple of years. Not surpringly, it’s TikTok (not in the chart above) that has been faring better, with engagement levels a lot higher than its rivals. This is true for travel but also for all other industries surveyed in this report.
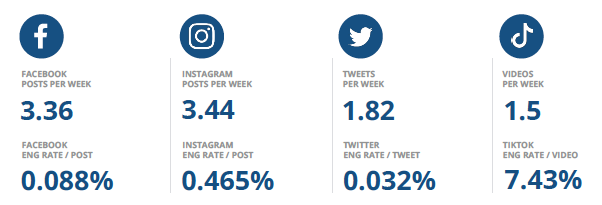
Here is the summary of posting frequency and engagement rates in travel, on the four key social platforms monitored in this report.
Source: Rival IQ, 2023 Social Media Industry Benchmark report
How does this compare with other industries?
Here is the median across all industries vs Travel:
- Facebook median posts per week: 5.04 vs 3.36 in travel
- Facebook median engagement rate per post: 0.06% vs 0.09% in travel
- Instagram median posts per week: 4.6 vs 3.4 in travel
- Instagram median engagement rate per post: 0.47% vs 0.47% in travel (same)
- Twitter median tweets per week: 3.91 tweets vs 1.82 in travel
- Twitter median engagement rate per tweet: 0.035% vs 0.032% in travel
- TikTok median videos per week: 1.75 vs 1.5 in travel
- TikTok media engagement rate per video: 5.69% vs 7.43% in travel
As we can see, travel and hospitality brands seem to be posting less than other industries across all four key social media. It is, however, getting better engagement rates, in particular on Facebook and TikTok.
NOTE: Companies that were monitored in this report had to meet minimum requirements. For example, minimum 25k followers on Facebook, and at least 5k followers on TikTok, Instagram and Twitter. So this obviously excludes smaller pages that tend to get higher engagement results.
2. Photos still rock on Facebook
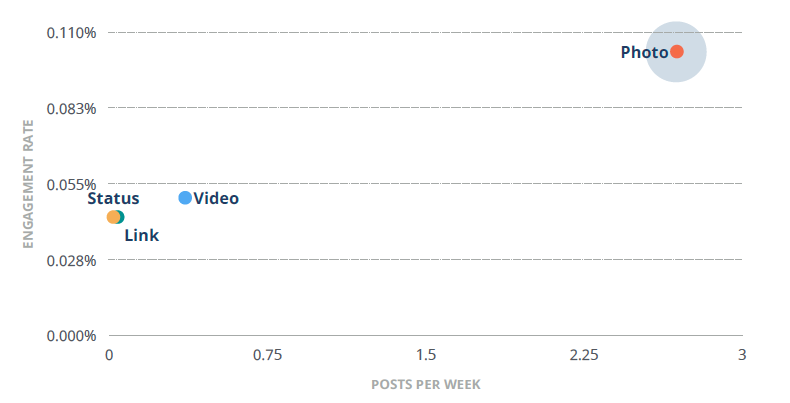
Not every industry yields similar results when it comes to looking at best performing content on specific platforms. On Facebook, for example, travel brands should bank on photos as this is the format that provides best organic engagement rates.
Source: Rival IQ, 2023 Social Media Industry Benchmark report
3. Brands should post reels on Instagram
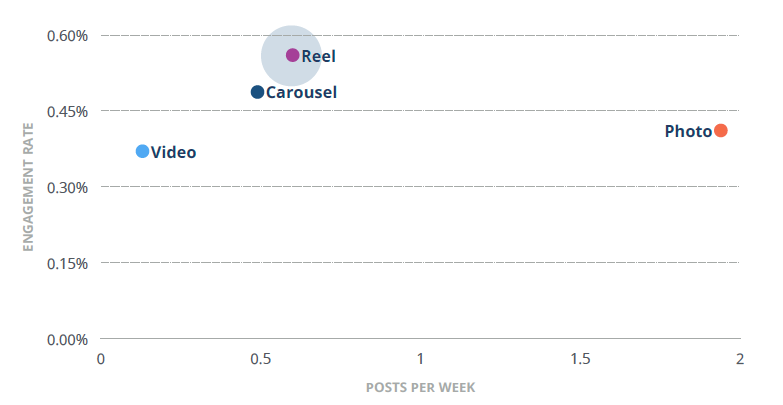
Across every industry, Instagram saw its reels perform best in terms of engagement rates, even few brands are actively using them. This is also the case in travel.
Source: Rival IQ, 2023 Social Media Industry Benchmark report
As we can see in the chart above, travel and hospitality brands were 4x more likely to post photos on Instagram than any other format. Yet, it was reels that generated the best organic engagement rates, followed by carrousel format. Are you using either of these formats in your posting strategy?
4. TikTok is topping the charts
As mentioned above, TikTok remains the champion in terms of engagement rates across all industries, with a median of 5.69% per video posted on its platform. This is even higher in travel and hospitality, with a median of 7.43%!
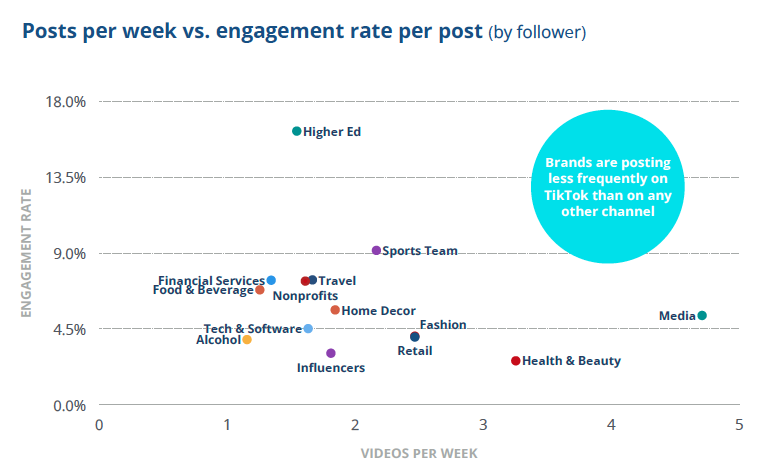
Source: Rival IQ, 2023 Social Media Industry Benchmark report
The chart above is quite telling, don’t you think? It shows clearly that posting more on TikTok does not necessarily mean getting better results, i.e. higher engagement rates. Media brands post feverishly, yet yield below median engagement rates while higher education brands post even less than travel brands, garnering engagement rates of over 16% per post!
Are you seeing similar results and observations within your organizations? Let me know in the comment section below.





Leave a Reply