Fall is a great season, with leaves changing colors, weather cooling into fresh, crisp mornings and nighttime coming around quicker, as days get shorter. For hospitality stakeholders, it’s also a great time to reflect upon the past summer season and start planning for the busy periods of Thanksgiving, the Holidays and the upcoming year.
With this in mind, here are eight statistics that underlie important shifts taking place, or not, in our industry!
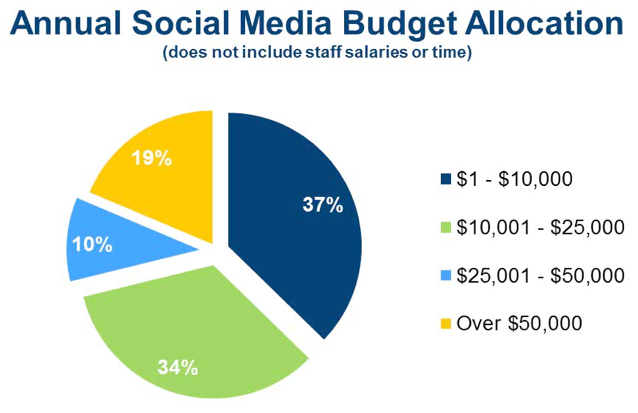
71% of DMO allocate 25,000$ or less to social media management
In a recent study conducted by DMAI, surveying over 100 travel marketing managers, it was found that 99% of organizations have a digital marketing budget, yet only 60% have a dedicated envelope for social media activities.
Perhaps even more surprising was the fact that 71% of DMO allocate less than 25,000$ to their social media activities. In fact, more than 1 in 3 (37%) have to make-do with less than 10,000$ as a yearly budget!
Read also: Social Media Challenges in Destination Marketing
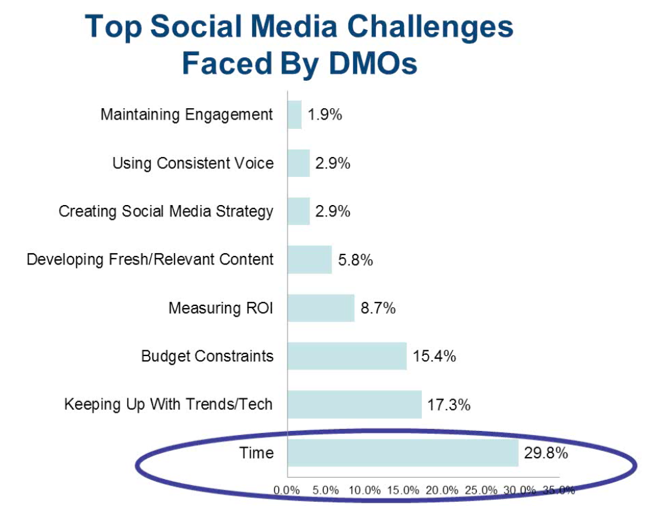
30% of social media managers say “Time” is their biggest challenge!
Despite of all the talk with regards to the difficulty to demonstrate Return on Investment (ROI), or perhaps even budget contraints, it appears the biggest social media challenge DMO managers are facing is… lacking time to do it all!
Notice that “keeping up with trends/tech” comes in second, which underlies the lack of time to understand all the new platforms and possibilities and thus “developing fresh and relevant content”, which comes only 5th amongst top social media challenges.
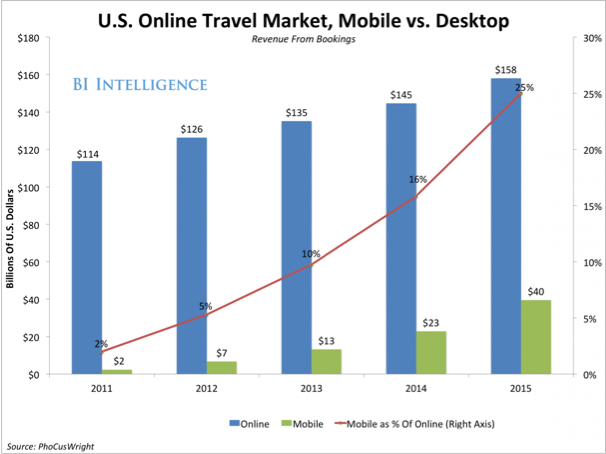
25% of online travel revenues will come from mobile in 2015
Pundits have been saying “this year will be THE year of mobile” for, well, years now. It seems like we finally hit that milestone in 2013, when revenues from travel bookings online, coming from a mobile device (smartphone or tablet), reached double digits (10%) for the first time. In 2014 this figure is estimated to reach 16-18%, and should represent one out of every fours dollars generated online in 2015!
Mobile search in travel, meanwhile, reached 25% of total online travel search queries in 2012, and was estimated to be at 40% in 2013, increasing steadily across devices.
For more on this: Mobile Best Practices in Travel Marketing
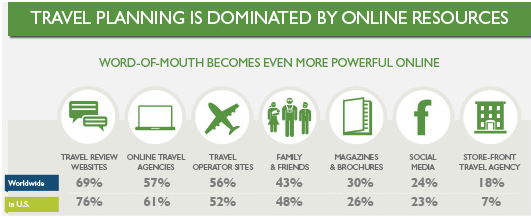
170 million reviews on TripAdvisor
When it comes to TripAdvisor, statistics are mind-blowing, to say the least. Latest figures show 170 million reviews, with over 280 million unique visitors on its website… per month! And that doesn’t include subsidiary sites such as daodao.com in China…
There are now more than 4 million properties listed across 42 countries, and 77% of users will seek reviews about accommodation, 50% about restaurants, and 44% about attractions. These reviews have an increasingly important role in the decision-making process, even more so, it seems, than online travel agencies or even friends and relatives!
Photos increase engagement on TripAdvisor by at least 138%
An even more recent study conducted by TripAdvisor tells us how important pictures have become in our thought-process when considering hotels and restaurants. Indeed, compared to hotels without any photo:
- Properties with at least one photo see an increase of +138% in travel engagement
- Properties with more than 100 photos see an increase of +151% in travel engagement
- Properties with more than 1,000 photos see an increase of +203% in travel engagement
These findings make sense, since one would assume a traveler spends more time looking at photos and videos on a hotel or B&B page if there are more photos to begin with. What’s even more interesting is to find out this actually leads to more booking inquiries! In fact, compared to properties that have no photos:
- Properties with at least one photo have +225% more likelihood of booking inquiry
- Hotels with more than 100 photos have +238% more likelihood of booking inquiry.

Read more: Photos Impact Bookings More Than Reviews
Only 27% of hoteliers communicate with clients prior to their arrival
We spend so much time preparing for a trip that anticipation has become a big part, if not the biggest, of the whole travel experience. It’s disappointing to see how very few hoteliers and industry stakeholders bother to foster that excitement pre-arrival, with only 27% of hotelers sending out emails and/or newsletters suggesting things to see and do at the destination.
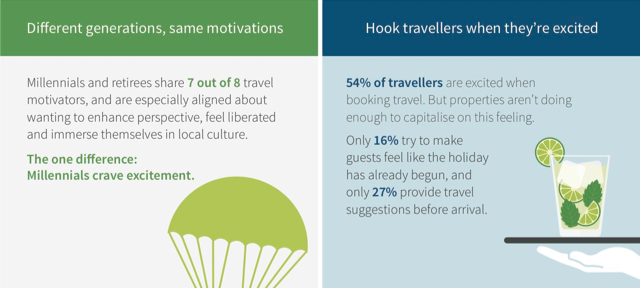 Read: What Motivates Us to Travel
68% of leisure travelers begin their search online without a destination in mind
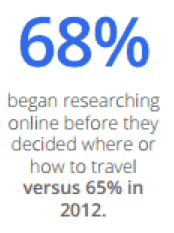 Every year, Think with Google publishes its Traveler report to better understand how leisure, business and affluent travelers research and book their travel. In 2012, we found out an astonishing 65% of leisure travelers began their search online without a destination in mind, or mode of transportation.
In other words, there is plenty of space upstream to mold the minds of potential travelers towards any given destination, for any given activities. In 2013, this figure was up and now represents 68% of leisure travelers. What will it be in 2014 and 2015?
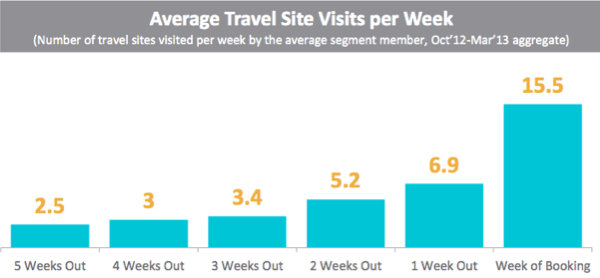
US travelers average 38 travel site visits before booking a trip
Another key number to keep in mind when crafting an online strategy in travel: people shop around before booking a package. A lot. According to an Expedia Media Solutions report published in October 2013, US travelers will visit 38 travel sites over a period of 5 weeks before booking a trip.
In September 2014, Expedia Media Solutions looked at the UK market to see if things were different. Indeed, there were variations in how visits spread, or which sites would be more visites (OTAs, TripAdvisor, destination sites, etc.). In the UK, travelers visit 35 travel sites, so this amount is fairly consistent and shows the challenge that lies ahead in getting travel industry stakeholders to have a dynamic, mobile-friendly and transactional site with email opt-in strategies and remarketing tactics as well.
Staying top-of-mind across this 5-week period is key!
Which stat surprises you most? Do you know of any other key metric that should have been featured on this list? Let me know in the comment section below.


Leave a Reply