It’s always interesting to analyze and find out how travelers go about making decisions when it comes to their online behavior. The folks at Expedia Media Solutions first took a look at the travel path to purchase in the US back in 2013, and then focused on behaviors in the UK in 2014, highlighting some small yet interesting differences between consumer habits in both areas.
Now for the first time, Expedia Media Solution included Canada in its analysis, with 2016 data. As could be expected, there are many similarities… but very telling differences as well!
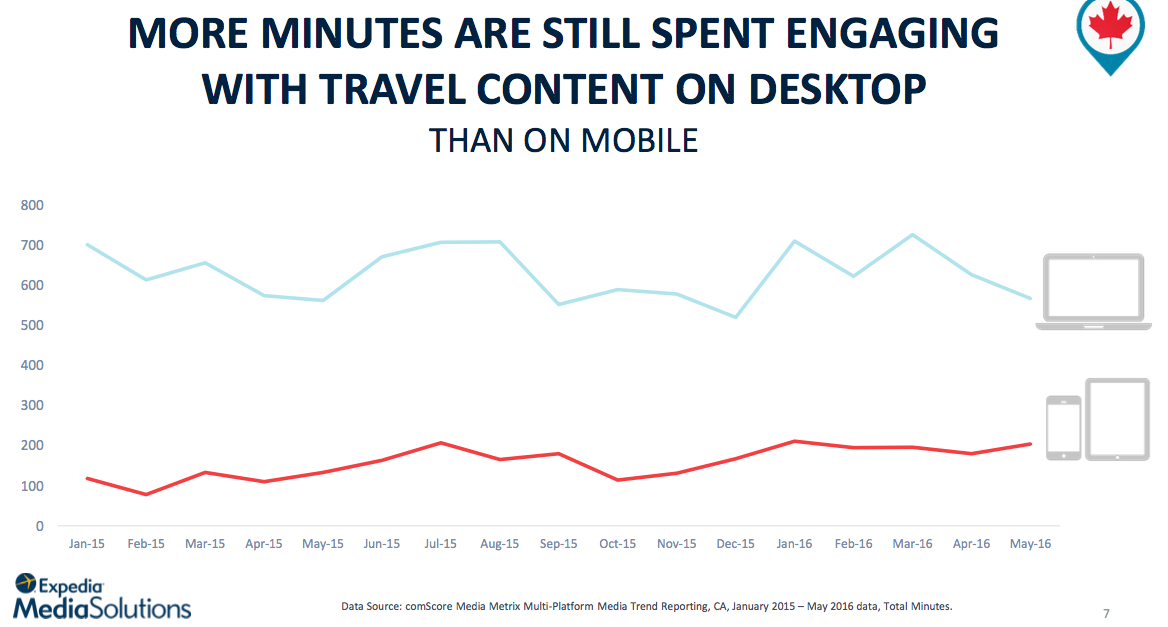
US & UK on mobile, Canada still on desktop
When looking at data spanning from January 2015 to April 2016, the report shows that there was a 44% year-over-year increase in time spent on travel content in the UK, which is similar to the 41% found in the US, but much more than the moderate 18% increase in Canada.
Also, Canada is known for having less choice when it comes to telcos, which means smartphone behaviors tend to lag behind across various verticals. This report highlights such lag when it comes to time spent on travel content comparing desktop to mobile.
In the US, mobile is now the dominant player while there has been a sharp increase in the UK, where time spent on travel content is almost the same on mobile and desktop. As for Canada, however, we still mostly rely on desktop!
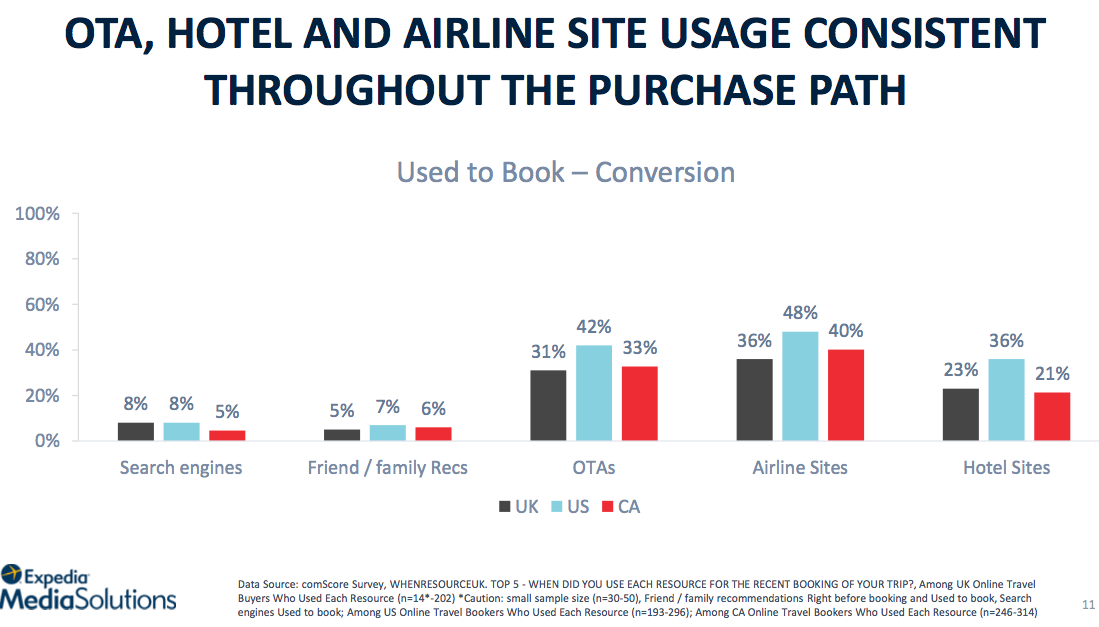
The report goes on to demonstrate how online behaviors may vary across the three geographical markets, yet we see there are few stark differences. Whether it’s about finding inspiration, or which site is most used when it comes to booking or seeking recommendations, the differences between UK, US and Canada travelers don’t jump out.
Online behaviors vary
Below is one example, comparing how users consult with OTA, hotel and airline websites.
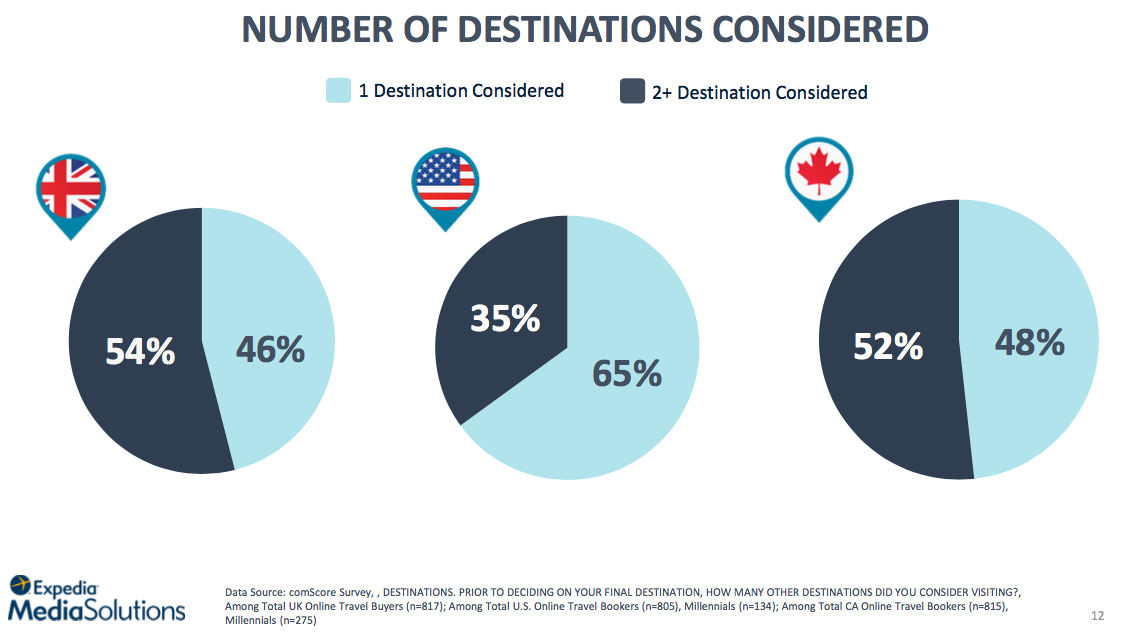
Where things start getting interesting is when comparing how many destinations travelers were considering before they made their final choice.
In Canada, a majority (52%) of users would be considering two or more, which is similar to what was found in the UK, where 54% of users considered two or more destinations, suggesting more volatility and perhaps better opportunities for destinations to woo Canadian or UK travelers.
For Americans, almost two-thirds of travelers have their mind on only one destination, suggesting a higher difficulty level in steering the decision-making process.
Many sites consulted
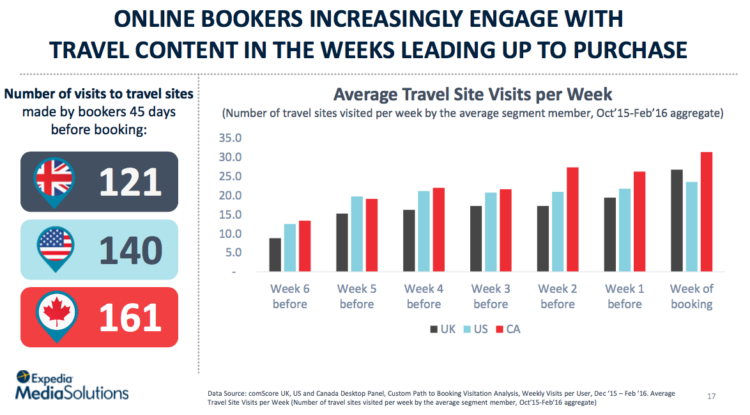
Another key difference was found in how many sites travelers will consult on average before making a decision. Specially when comparing with data from 2013 and 2014, back when it was found that US travelers would visit on average 38 sites, and UK travelers 35 sites, over a period of 45 days.
Fast-forward to 2016, and we’re seeing an explosion of travel sites being consulted during that same 45-day period, with 121 sites on average for the UK traveler, 140 sites in the US and a whopping 161 sites in Canada.
Looking at the chart below, it becomes quite clear that the extra sites Canadians tend to engage with appear later on the decision-making process, two weeks or less from the time of booking.

Note: It’s important to clarify that visits to travel sites can occur with the same site more than once. In other words, travelers can check out an OTA site, validate hotels on TripAdvisor, go directly to hotel sites for more info, come back to TripAdvisor for some more research, and so on.
These would all count as visits, even though a same site (i.e. TripAdvisor) may be visited more than once during the process.
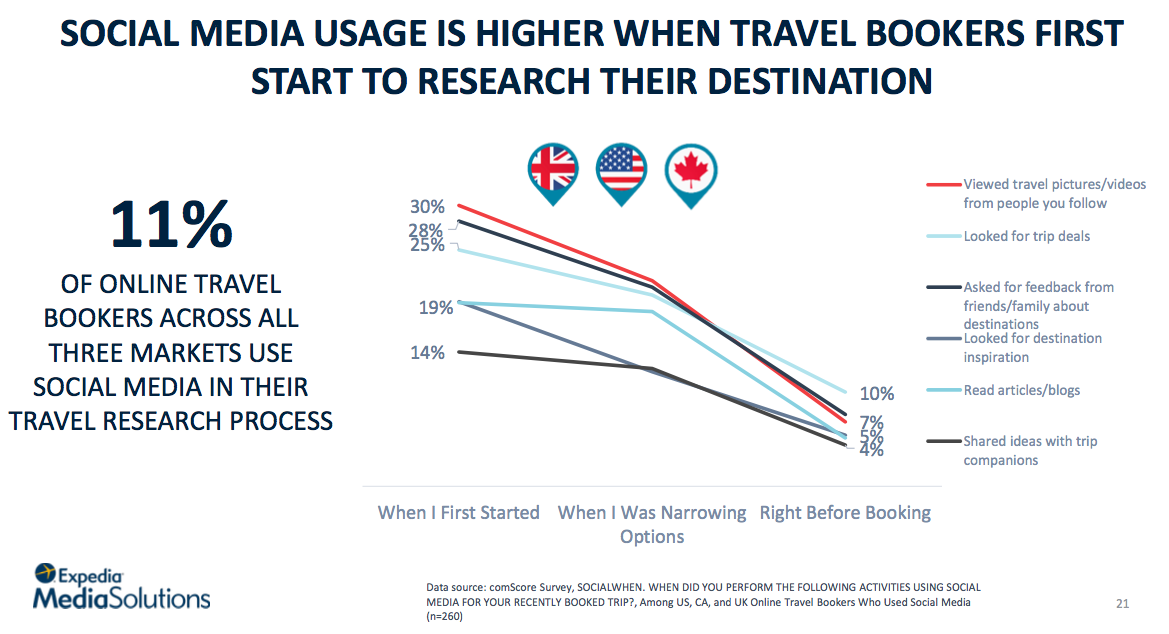
Social Media And Advertising Still Important
At a time when many destinations, hotels, restaurants and various industry stakeholders are questioning some of their social media initiatives, this report showcases at least one interesting finding regarding the role social media plays in the research process.
While only 11% of online travel bookers across all three markets use social media in their travel research process, we can see some variations per market and, more importantly, per what stage of the process they are at.
We can see how important travel pictures and videos are, in particular during the first stages of the research, before travelers narrow their options.
Even though social media remains relevant with organic results through compelling images, videos and user-generated contents shared on various popular social media accounts (Facebook, Instagram, Pinterest, Twitter, Snapchat), advertising can and will influence traveler destination decisions.
Whether this advertising is made on social media or across online outposts such as OTA sites, search engines or brand websites.
In fact, according to this study:
- 27% of US travel bookers were influenced by advertising when considering more than one location;
- In the UK, 30% travel bookers said they were influenced by advertising when considering more than one location;
- 38% of Canadian travel bookers were influenced by advertising when considering more than one location.
Just like with social media, it appears that advertising has most of its impact in the earlier stages of the travel booking path, specially when just started the research process, before users start narrowing options.
Another proof, if that was needed, that the earlier is the better when it comes to influencing online travelers in their booking path!
Read also: How Buying Travel Packages Differs: US vs UK


Leave a Reply