Now that you know how to prepare your very first email campaign, choose the right email marketing solution for your needs and create a successful newsletter, all you have to do is send it off and analyze the results of your email campaign. But how can you measure the effectiveness and engagement of your newsletter?
In this article, we will present the main key performance indicators (KPIs) you should follow to determine how successful your email campaign is. Always keep in mind the goal you set when you first prepared the email campaign and identify the KPIs that will show if you are headed towards achieving that goal or not.
KPIs you should monitor
Above all, there are some metrics you should compile as they are really interesting to calculate the performance of your newsletter:
- Emails sent
- Bounced emails
- Opened emails
- Opened emails on mobile devices
- Number of clicks
- Amount of subscriptions
- Amount of unsubscribes
When you use an email marketing solution, don’t forget to regularly view the reporting section to get an overview of the performance of each email campaign.
With the data indicated above, you will be able to calculate the success and engagement rates of your email marketing campaigns.

Delivery rate
To how many people (or emails) did you send your newsletter? How many of those emails actually got delivered?
It is important to remember your newsletter’s target audience—and segment your distribution list accordingly. You can decide whether or not a type of customer, for example, will receive a specific newsletter.
Do you want optimal results? Segment your newsletter subscriber list! Did you know that segmented email campaigns have open rates that are 14.32% higher than campaigns that are not segmented?
Delivery rate = (Number of emails sent – number of bounced emails) / number of emails sent x 100
The delivery rate is the number of emails that were actually delivered versus the total number of emails sent.
This rate should be relatively high—over 95%—and help you to determine the quality of your subscriber list. Having a lower delivery rate can be caused by several factors, including sending a newsletter long after people subscribed to it.
You must have a list of active and engaged subscribers. Take the time to clean your subscriber list and delete invalid emails or people who never read your newsletters.
Bounce rate
The bounce rate represents all the emails that were sent but did not reach the recipients; in other words, they bounced back. There are two types of undeliverable emails: the soft bounce and the hard bounce.
Ideally, you should always try to minimize bounced emails to keep your email list up to par. Soft bounces are caused by temporary issues, such as a full inbox, faulty server or an email that is too big for someone’s email program. Hard bounces are permanent issues, such as an invalid email address or an email that no longer exists. This latter type of bounce is more problematic.
Bounce rate = number of bounces / number of emails sent x 100
A high bounce rate is a red flag that your email list is not up-to-date. You must continuously clean your subscriber list; if not, you may end up being considered as an unwanted sender.
This could negatively impact the performance of your upcoming newsletters.
Open rate
Regardless of the number of newsletters you send out, the most important thing for a successful email campaign is that your newsletter is open and read. Why would you need a million of subscribers if none of them open your emails?

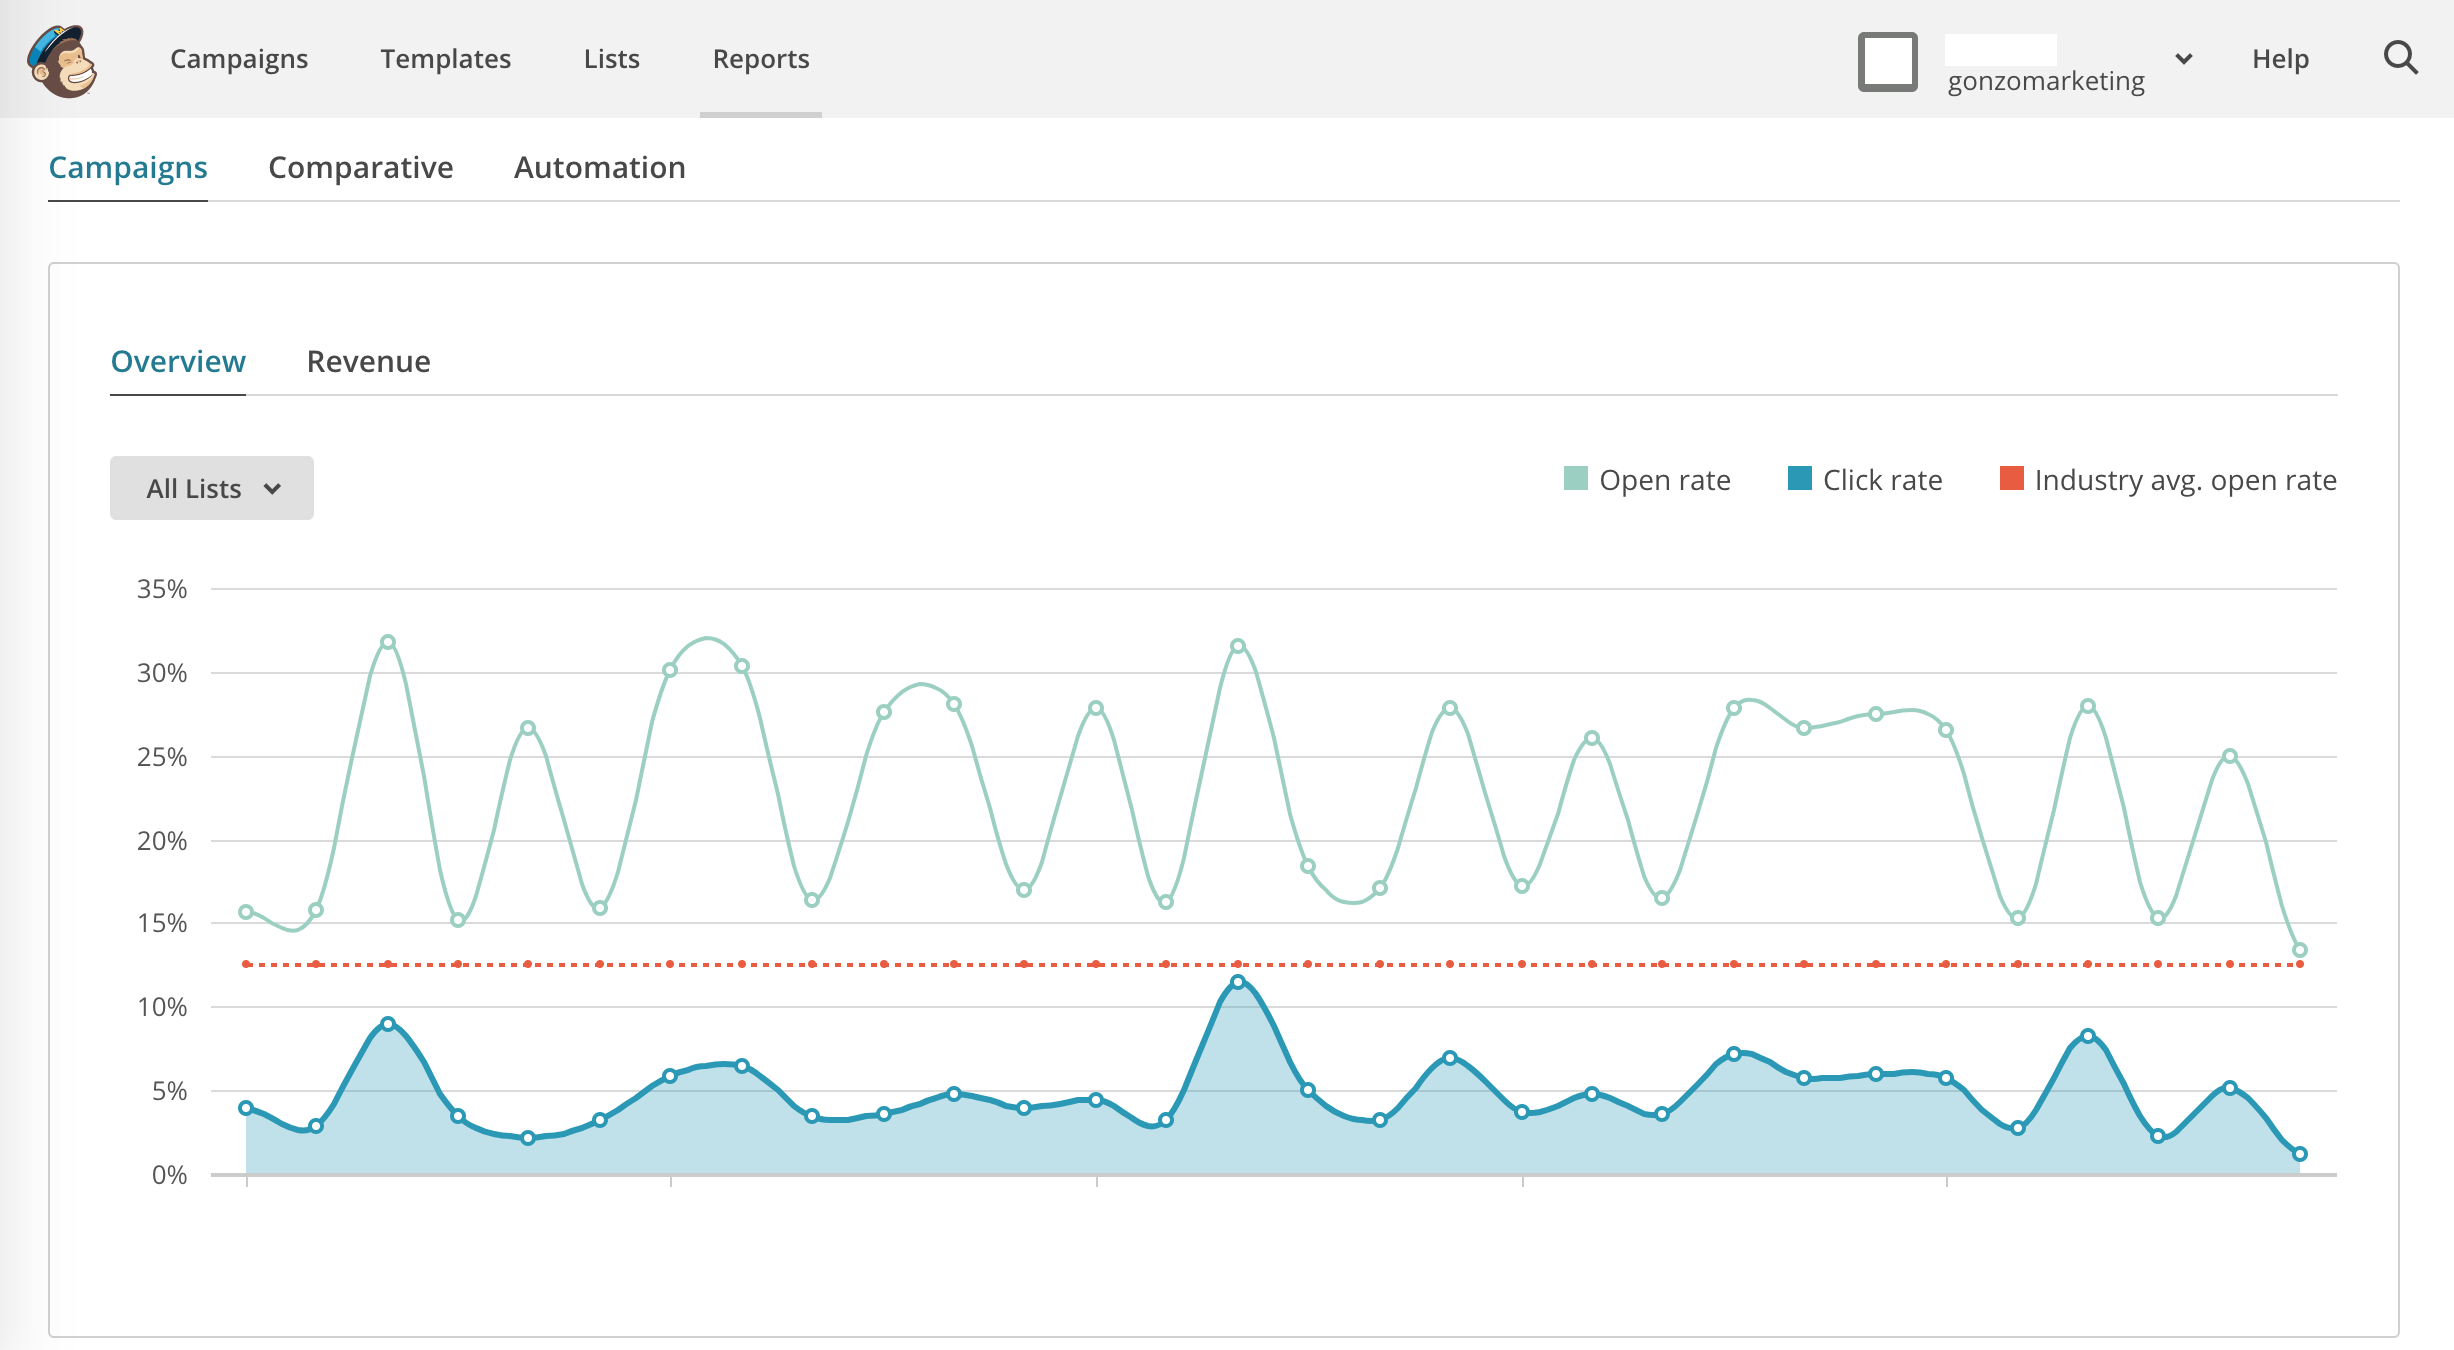
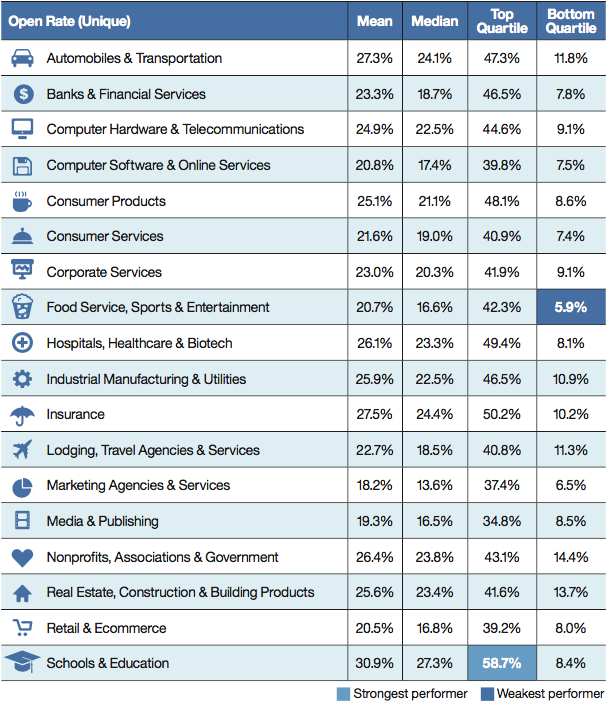
The number of opened emails represents the exact number of recipients who received and opened your newsletter. The open rate of a newsletter hovers between 15% and 30%; oftentimes the average open rate is around 24%–all industries combined.
Open rate = number of opened emails / (number of emails sent – number of bounced emails) x 100
While your open rate may be an interesting stat to look at, keep in mind that some programs open emails by default, thereby skewing your open rate results.
However, if your email open rate is lower than average, it may mean that your email is not optimized. Incite recipients to click and open your email by briefly describing your newsletter’s content.
Click-through rate
The most important KPI for your email marketing campaign is the click-through rate. Regardless of the number of subscribers and open rate, the click-through rate enables you to accurately determine if your newsletter content is interesting—or not—for recipients.
The number of clicks equals the number of clicks made in your newsletter after it has been opened and viewed. The click-through rate is a clear representation of how interested readers are and gives you a good indication that recipients actually read at least a part of your newsletter.
Click-through rate (CTR) = number of clicks / (number of emails sent – number of bounced emails) x 100
Click-to-open rate (CTOR) = number of clicks / number of emails opened x 100
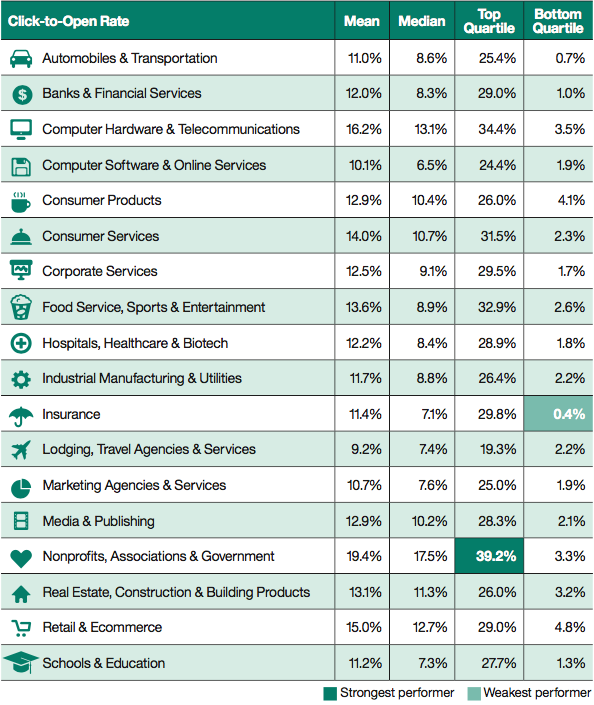
You can monitor two rates: the click-through rate, which applies to all of the emails you send out, and the click-to-open rate, which applies only to newsletter emails that have been opened.
The click-through rate can vary based on how big your subscriber list is, the email’s contents, and number of links. However, we estimate that a good CTR is approximately 15%.
If your CTR or CTOR is above this average, it means your newsletter is useful and interesting. Its calls to action (CTAs) are most likely very effective. If your CTR is below average, get working on optimizing your links, CTAs and newsletter content!

Conversion rate
The conversion rate is one of the most important KPIs to keep track of for your email campaigns. In fact, the ultimate goal of your newsletter—after succeeding in getting people to open your newsletter and generating clicks—is to trigger a conversion towards your business, products or services.
You want readers to perform an action with respect to your company and marketing goals, such as subscribe to a list, download a file, make a purchase, sign up for something, or even fill out a survey. A conversion is therefore an action carried out by an email recipient after an interaction with your newsletter (a click, for example).
Conversion rate = number of people who performed the action you wanted them to do / (number of emails sent – number of bounced emails) x 100
Unsubscribe rate
While the unsubscribe rate shouldn’t be your newsletter’s main KPI, you should keep an eye on it to pinpoint how many people unsubscribe to your newsletter after having opened it.
Unsubscribe rate = number of people who unsubscribe / (number of emails sent – number of bounced emails) x 100
The unsubscribe rate shows you how much people appreciate your content and the frequency you at which you send out emails. An unsubscribe rate that is lower than 2% is an industry average.
However, if you have a high unsubscribe rate, you may be sending too many emails or your content is not as relevant for your subscribers. Try sending out less newsletters and creating content that is more adapted to your subscriber personas.
Additional KPIs can be analyzed to understand how effective your email campaigns are. In this article, we gave you an overview of the most widely known and important KPIs to measure your newsletter’s success.
Don’t forget to identify the KPIs that are right for your business and marketing objectives. With this data, you will be able to measure and optimize all of your email marketing campaigns!


Leave a Reply