
When I tell a hotel GM or a DMO director that we can now measure their visibility inside ChatGPT or Gemini, I often get the same reaction: polite interest, followed by a raised eyebrow. “You can actually measure that?” Yes. Yes we can. And rather than explain it in the abstract one more time, I figured I’d pull a few recent audit reports off the shelf and show you, in black and white, what we hand back to our hospitality and tourism clients.
Over the past year or so, we’ve run a string of digital audits across the travel and hospitality world: year-round resorts, boutique inns, a heritage hotel, regional destination marketing organizations, an outdoor adventure operator, a private ski hill, etc. The examples below are real, but anonymized, with round numbers and names stripped out for confidentiality. The point isn’t to call anyone out, bur rather to show the kind of findings that surface once you actually look.
Chart one: the discoverability scorecard
The discoverability scorecard is the fastest way to summarize where a property or destination stands across AI engines. Each criterion gets rated on a simple scale, green to red. The example below comes from the audit of a well-known four-season resort with a genuinely polished website and digital presence.
| Discoverability criterion | Rating |
|---|---|
| Overall AI visibility | Medium to low |
| Visibility — ChatGPT | Acceptable |
| Visibility — Perplexity | Medium |
| Visibility — Google AI (Gemini, AI Overviews) | Low |
| Accuracy of information | Needs work |
| Understanding of the destination’s territory | Needs work |
| Tone and positioning | Acceptable |
| Freshness of content | Acceptable |
| Authority of sources | Low |
What jumps out is the contrast. The tone is upbeat, the content is current, the brand is internationally recognized. And yet two lines are flashing red: visibility inside the Google AI ecosystem, and recognition as an authoritative source. In other words, a resort can check every traditional box and still be nearly invisible exactly where travelers are increasingly starting their search. That’s a nuance a simple “we rank well on Google” completely misses.
We also run brand-visibility tests using pre-built sets of real traveler prompts, to see how often — and how favorably — a property surfaces in conversations with the leading AI models.
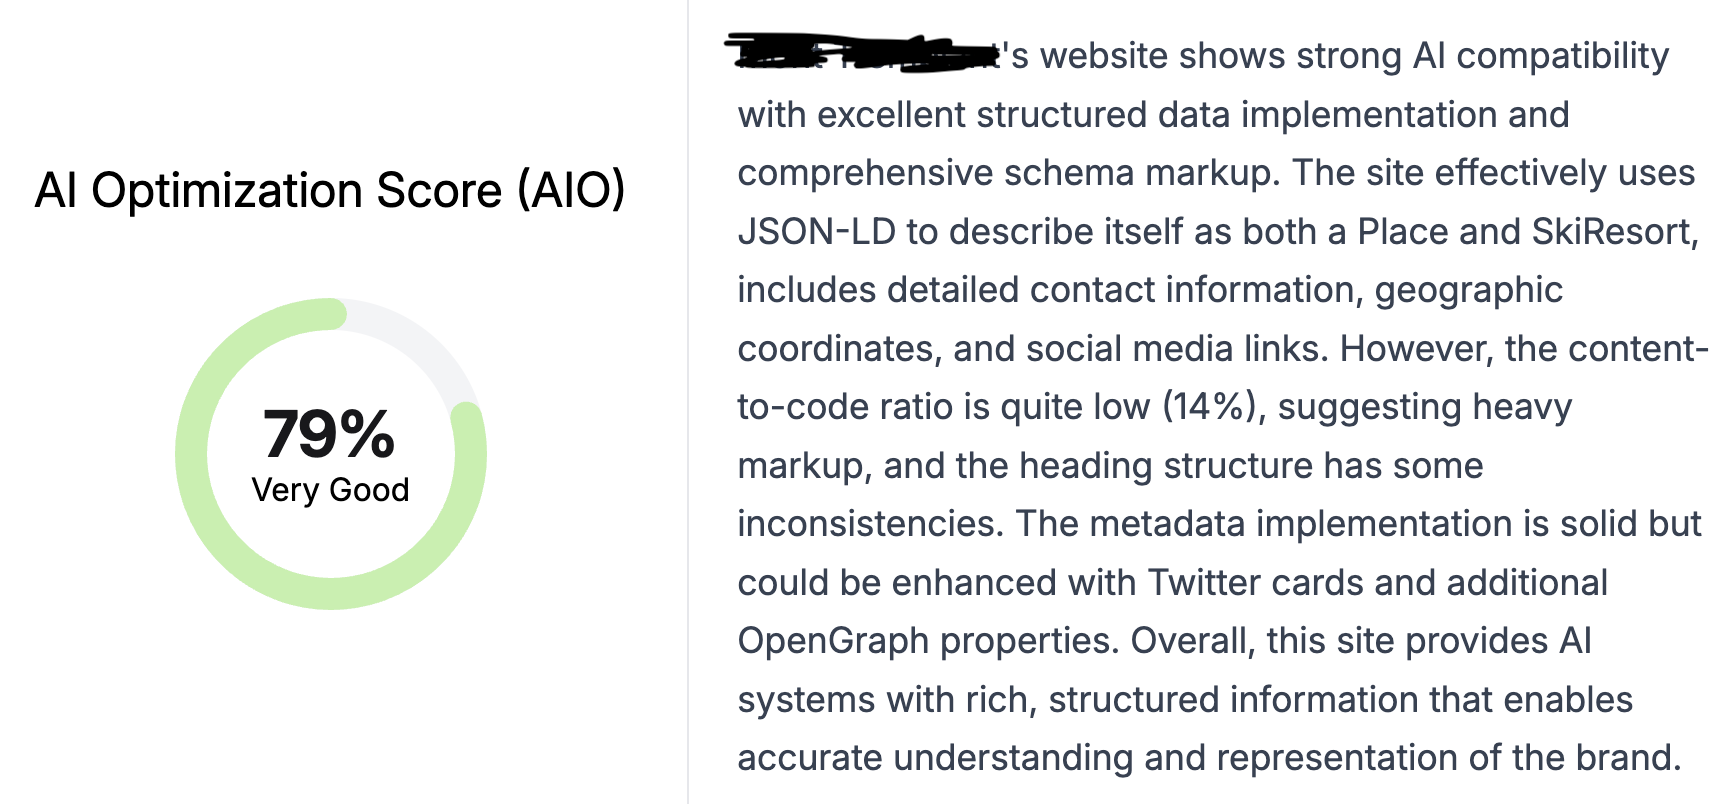
We typically pair that with a competitive benchmark, to see how a property or destination stacks up against comparable players in the same market. In one recent mandate for a regional DMO, the question was how the destination performed against nearby competitors for travelers weighing a handful of similar getaways within driving distance.
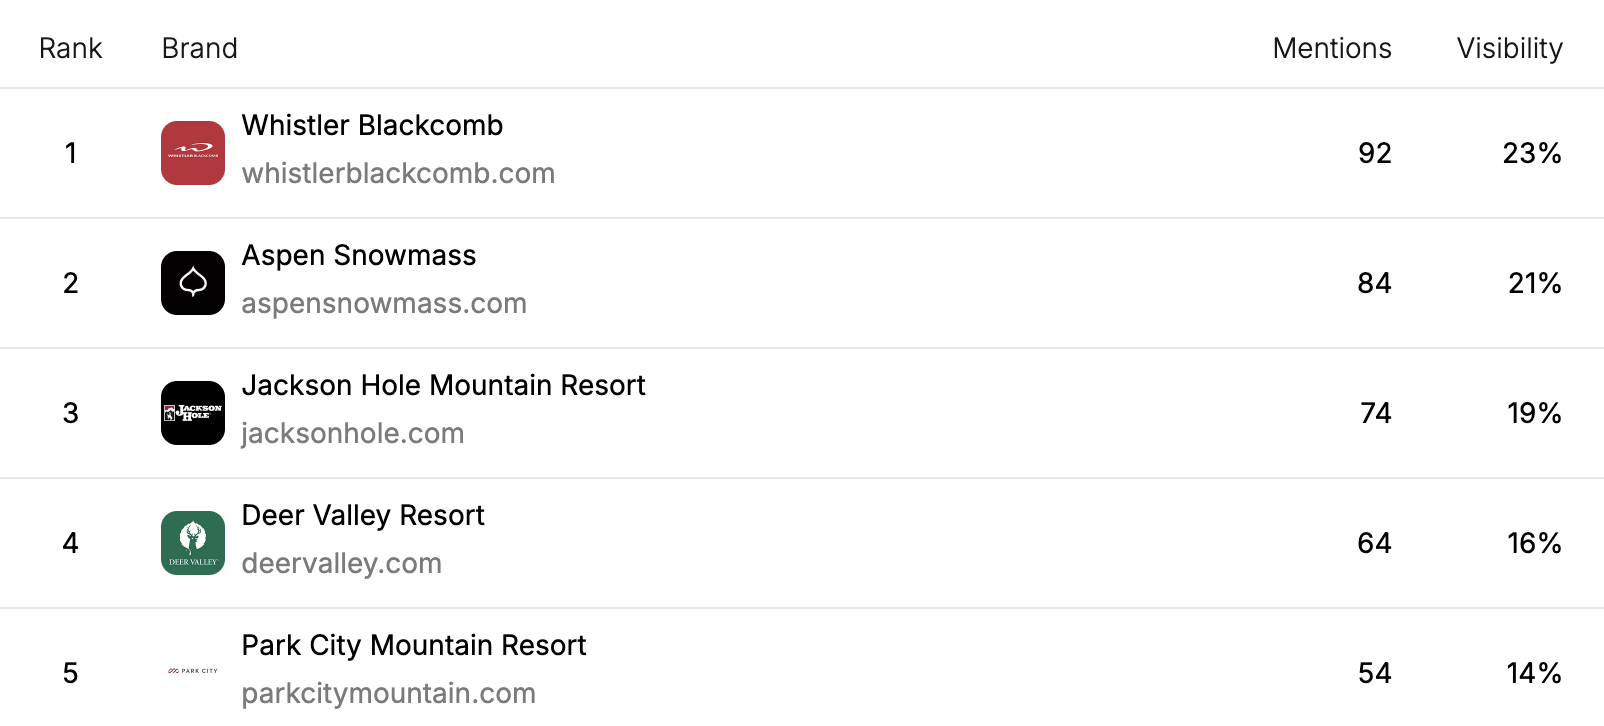
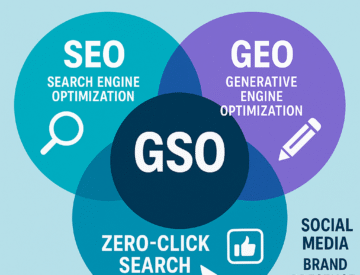
In this case it was a GEO analysis, looking at performance in key AI models, but we often take a look into SEO performance for a website as well as social media presence in order to validate overall presence online, which is taken into account by most AI models.
Chart two: three properties, three different realities
There’s a tempting assumption that AI visibility works like the weathe, meaning everyone experiences the same conditions at the same time. Not even close. Here’s how three of our clients, in three different corners of the travel industry, actually show up in AI-generated answers.
| Property (anonymized) | Presence in AI responses |
|---|---|
| A regional destination marketing organization | Cited in roughly 9 out of 10 responses; unprompted discoverability around 60% (2nd in its region) |
| A year-round resort | Under 10% of relevant responses |
| A regional tourist town | Roughly 1% presence; entirely absent for 4 of 6 traveler personas tested |
The surprise here is the DMO that outperformed two well-regarded travel destinations that looked far more “sellable” on paper. Why? Because destination-organization content (practical trip logistics, neighborhood breakdowns, real visitor questions) often answers exactly the kind of concrete queries AI models are built to cite. Tourism content, by contrast, is often written to seduce and inspire, a register the models tend to skip right past. It’s a slightly deflating lesson for the hospitality industry, but a useful one: a gorgeous website doesn’t make you visible. Useful content does.
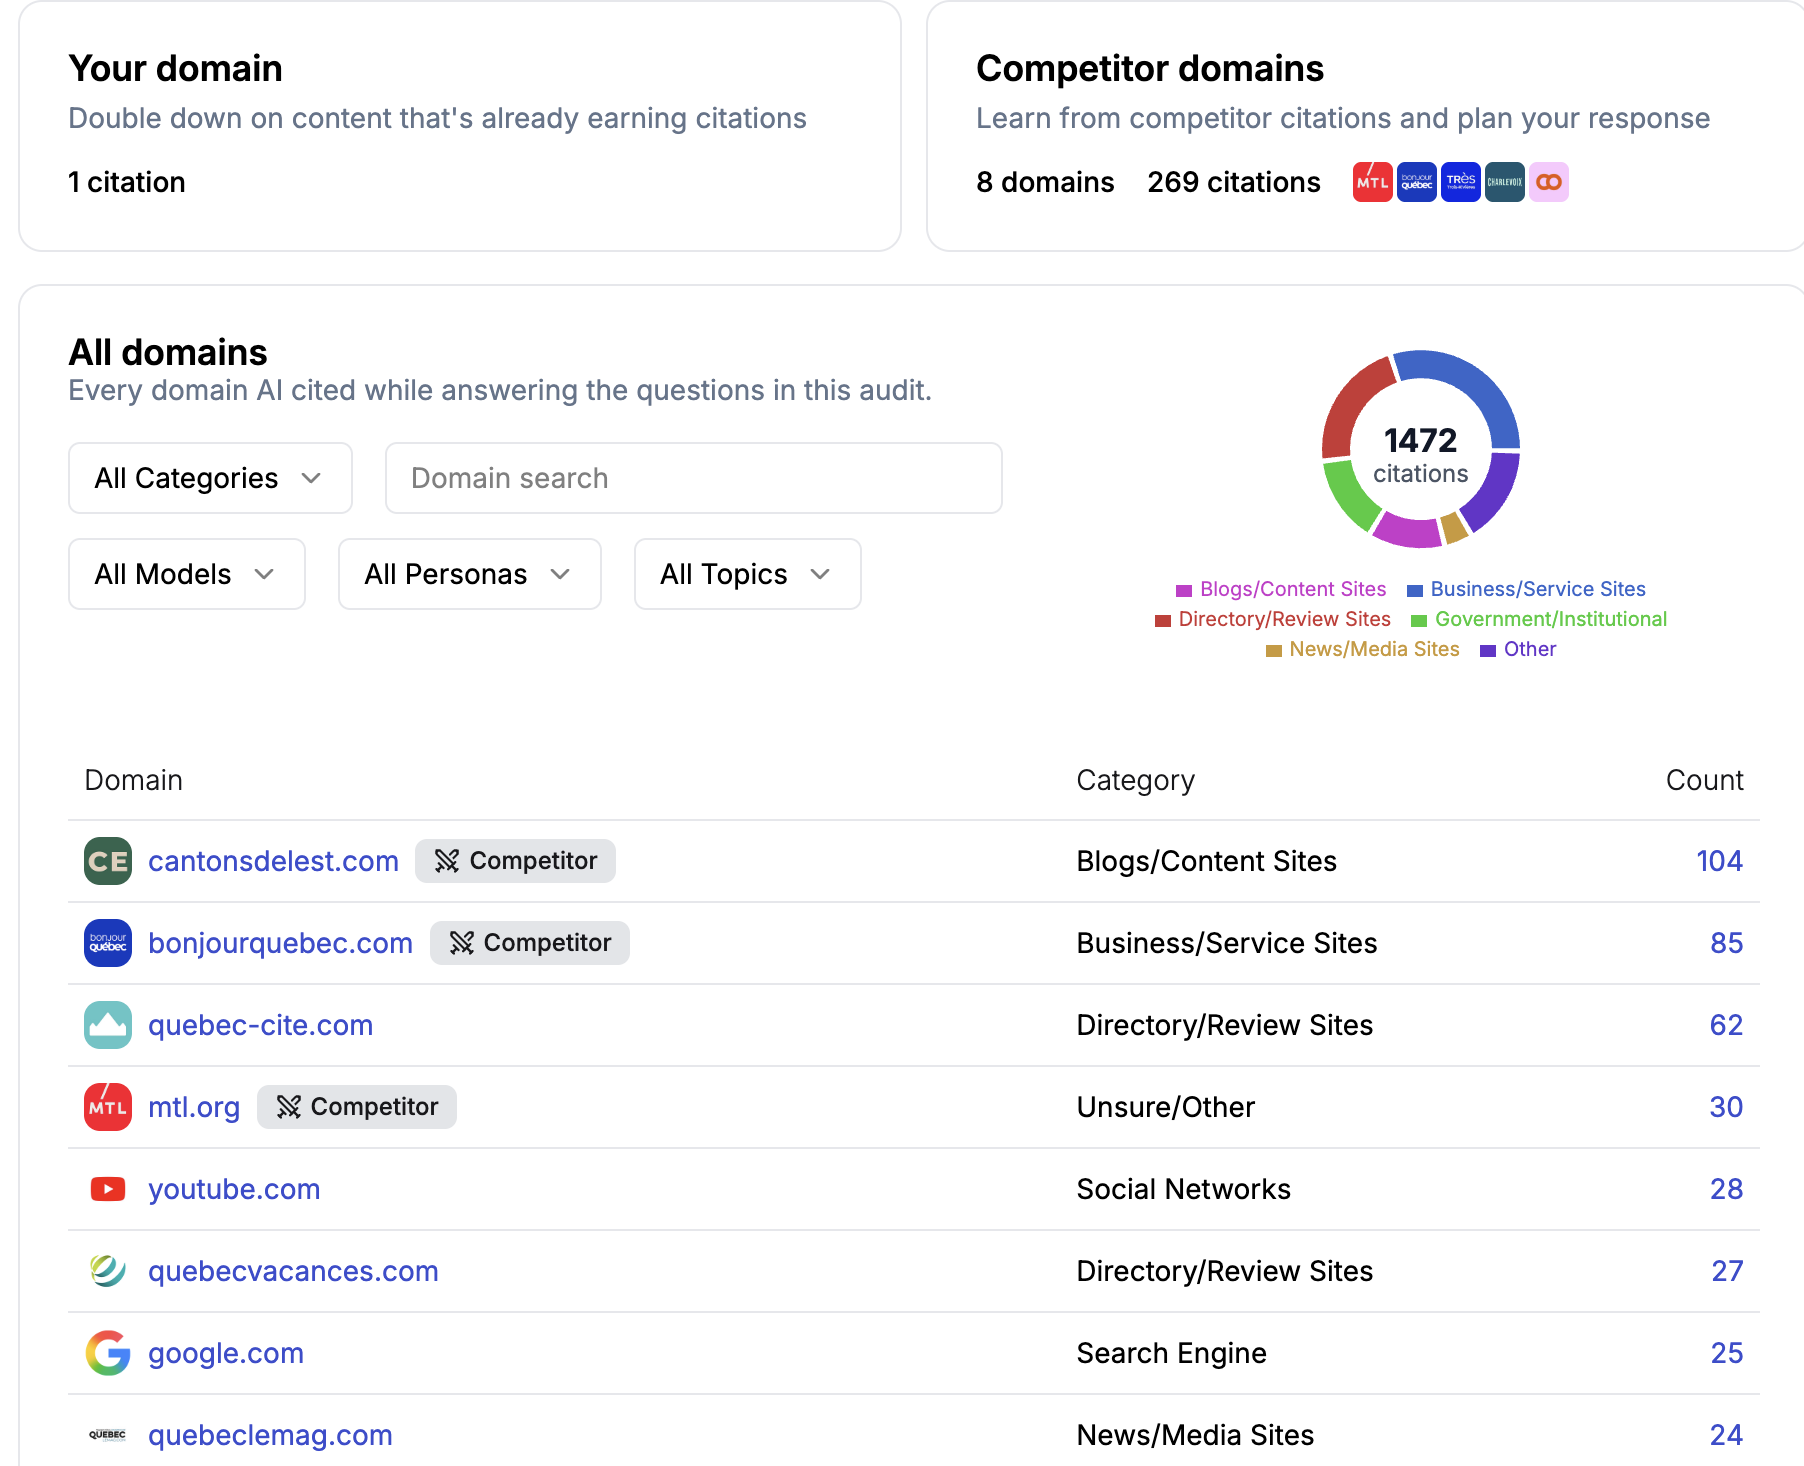
Chart three: who’s telling your story for you
When an AI recommends a property, it’s leaning on sources. We track those systematically, because they reveal who actually controls your narrative. Here are the most-cited sources from the audit of that same four-season resort.
| Rank | Source type cited by AI models |
|---|---|
| 1 | Collaborative encyclopedia and a major travel review site |
| 2 | Major booking and accommodation platform |
| 3 | International hotel chain with a property on-site |
| 4 | Regional tourism portals and travel magazines |
| 5+ | Forums, niche travel blogs, trade media |
| Marginal presence | The destination’s own official website |
That last line stings. The official site — the one that gets redesigned every few years, the one that costs real money to maintain — comes in dead last among the sources AI models treat as credible. Third parties, often private, for-profit platforms, are the ones actually shaping how your destination gets described. Your digital authority isn’t built on your own website alone; it’s built across the entire ecosystem talking about you. And right now, that ecosystem is getting along just fine without your permission.
The details that quietly kill you
An audit isn’t only about the big-picture trends. It’s also a magnifying glass over the small stuff, the kind of thing that bleeds bookings one guest at a time. A few findings pulled from recent reports.
| What we found | What it reveals |
|---|---|
| A suggested itinerary linking two far-apart regions in a single day | AI invents impossible routes when structured trip data doesn’t exist |
| A restaurant geotagged in the wrong town | Google Maps inconsistencies propagate straight into AI answers |
| A 1.5/5 Google listing dragging down an otherwise solid 4.1/5 average | One poorly managed listing is enough to tarnish an otherwise strong reputation |
| Nearly 19,000 visits to a broken error page in a single year | Dead links bleeding traffic, and AI crawlers turning back at the door |
| Mobile speed scoring 54 out of 100 | A slow site that impatient generative engines index poorly |
None of these is fatal on its own. Stacked together, though, they explain why a property that looks strong “on paper” struggles to surface in the new search interfaces travelers are increasingly using. And the good news: every single one of these is fixable, once you actually know it’s there.
The recommendations
A client once told me, handing back a report: “The findings, I kind of suspected. What I was really waiting for was the plan.” Fair enough. The most anticipated part of any audit isn’t the diagnosis — it’s what comes after it. Here’s an anonymized, condensed sample of the recommendations we typically hand to travel and hospitality clients, sorted by timeline.
| Recommendation | Timeline |
|---|---|
| Build out a plain-language FAQ answering the real questions guests actually ask | Immediate |
| Beef up thin pages so they’re “answerable” by AI engines — and genuinely useful to a human | Immediate |
| Claim and clean up Google listings: respond to reviews, refresh photos, standardize information | Short term |
| Fix technical irritants: broken links, mobile speed, heading structure | Short term |
| Increase mentions in trade media, blogs and sector directories, to build links and authority | Medium term |
| Build a pillar-and-persona content strategy to rebalance the narrative across every facet of the property | Medium to long term |
| Redefine success metrics and retest AI visibility at 6, 12 and 24 months | Long term |
None of this is magic. These are concrete, often low-cost moves you can start on tomorrow morning. The real challenge isn’t doing everything at once — it’s knowing where to start. That’s exactly what the “immediate” to “long term” sequencing is meant to settle. Because the best recommendation was never the most ambitious one. It’s the one the client will actually act on.
Note: the table above is illustrative — it shifts from one client to the next, one segment of the industry to the next. Common threads do emerge, since every traveler is navigating the same digital ecosystem. What varies is the toolkit: how strong a property’s social presence already is, how recent the website is, how deep and fresh the content sits on the site, the blog, or elsewhere.
Why the audit matters
These charts are only a slice of what we deliver. Every report combines a classic SEO layer — technical site health, speed, social, Google Business listings — with a GEO layer, testing visibility across ChatGPT, Perplexity, Gemini and AI Overviews through hundreds of real traveler queries. Then comes the action plan above, because a diagnosis with no follow-through doesn’t get anyone closer to a booking.
The process is a bit like an X-ray. It doesn’t cure anything by itself, but it turns a vague worry — or a question nobody could answer — into a precise, numbers-backed picture you can finally act on. For a lot of hospitality leaders, seeing their own property’s scorecard is what turns the initial skepticism into action.
Curious what your own scorecard would look like — SEO, GEO, or both? That’s exactly the kind of engagement we run. You’ll find the different formats, depending on the depth of analysis you need, on my services page.
We can now measure what used to feel unmeasurable. The only question left is how your property or destination is actually scoring on discoverability.







Leave a Reply